Evaluate models with Weave
W&B Weave is a purpose-built toolkit for evaluating LLMs and GenAI applications. It provides comprehensive evaluation capabilities including scorers, judges, and detailed tracing to help you understand and improve model performance. Weave integrates with W&B Models, allowing you to evaluate models stored in your Model Registry.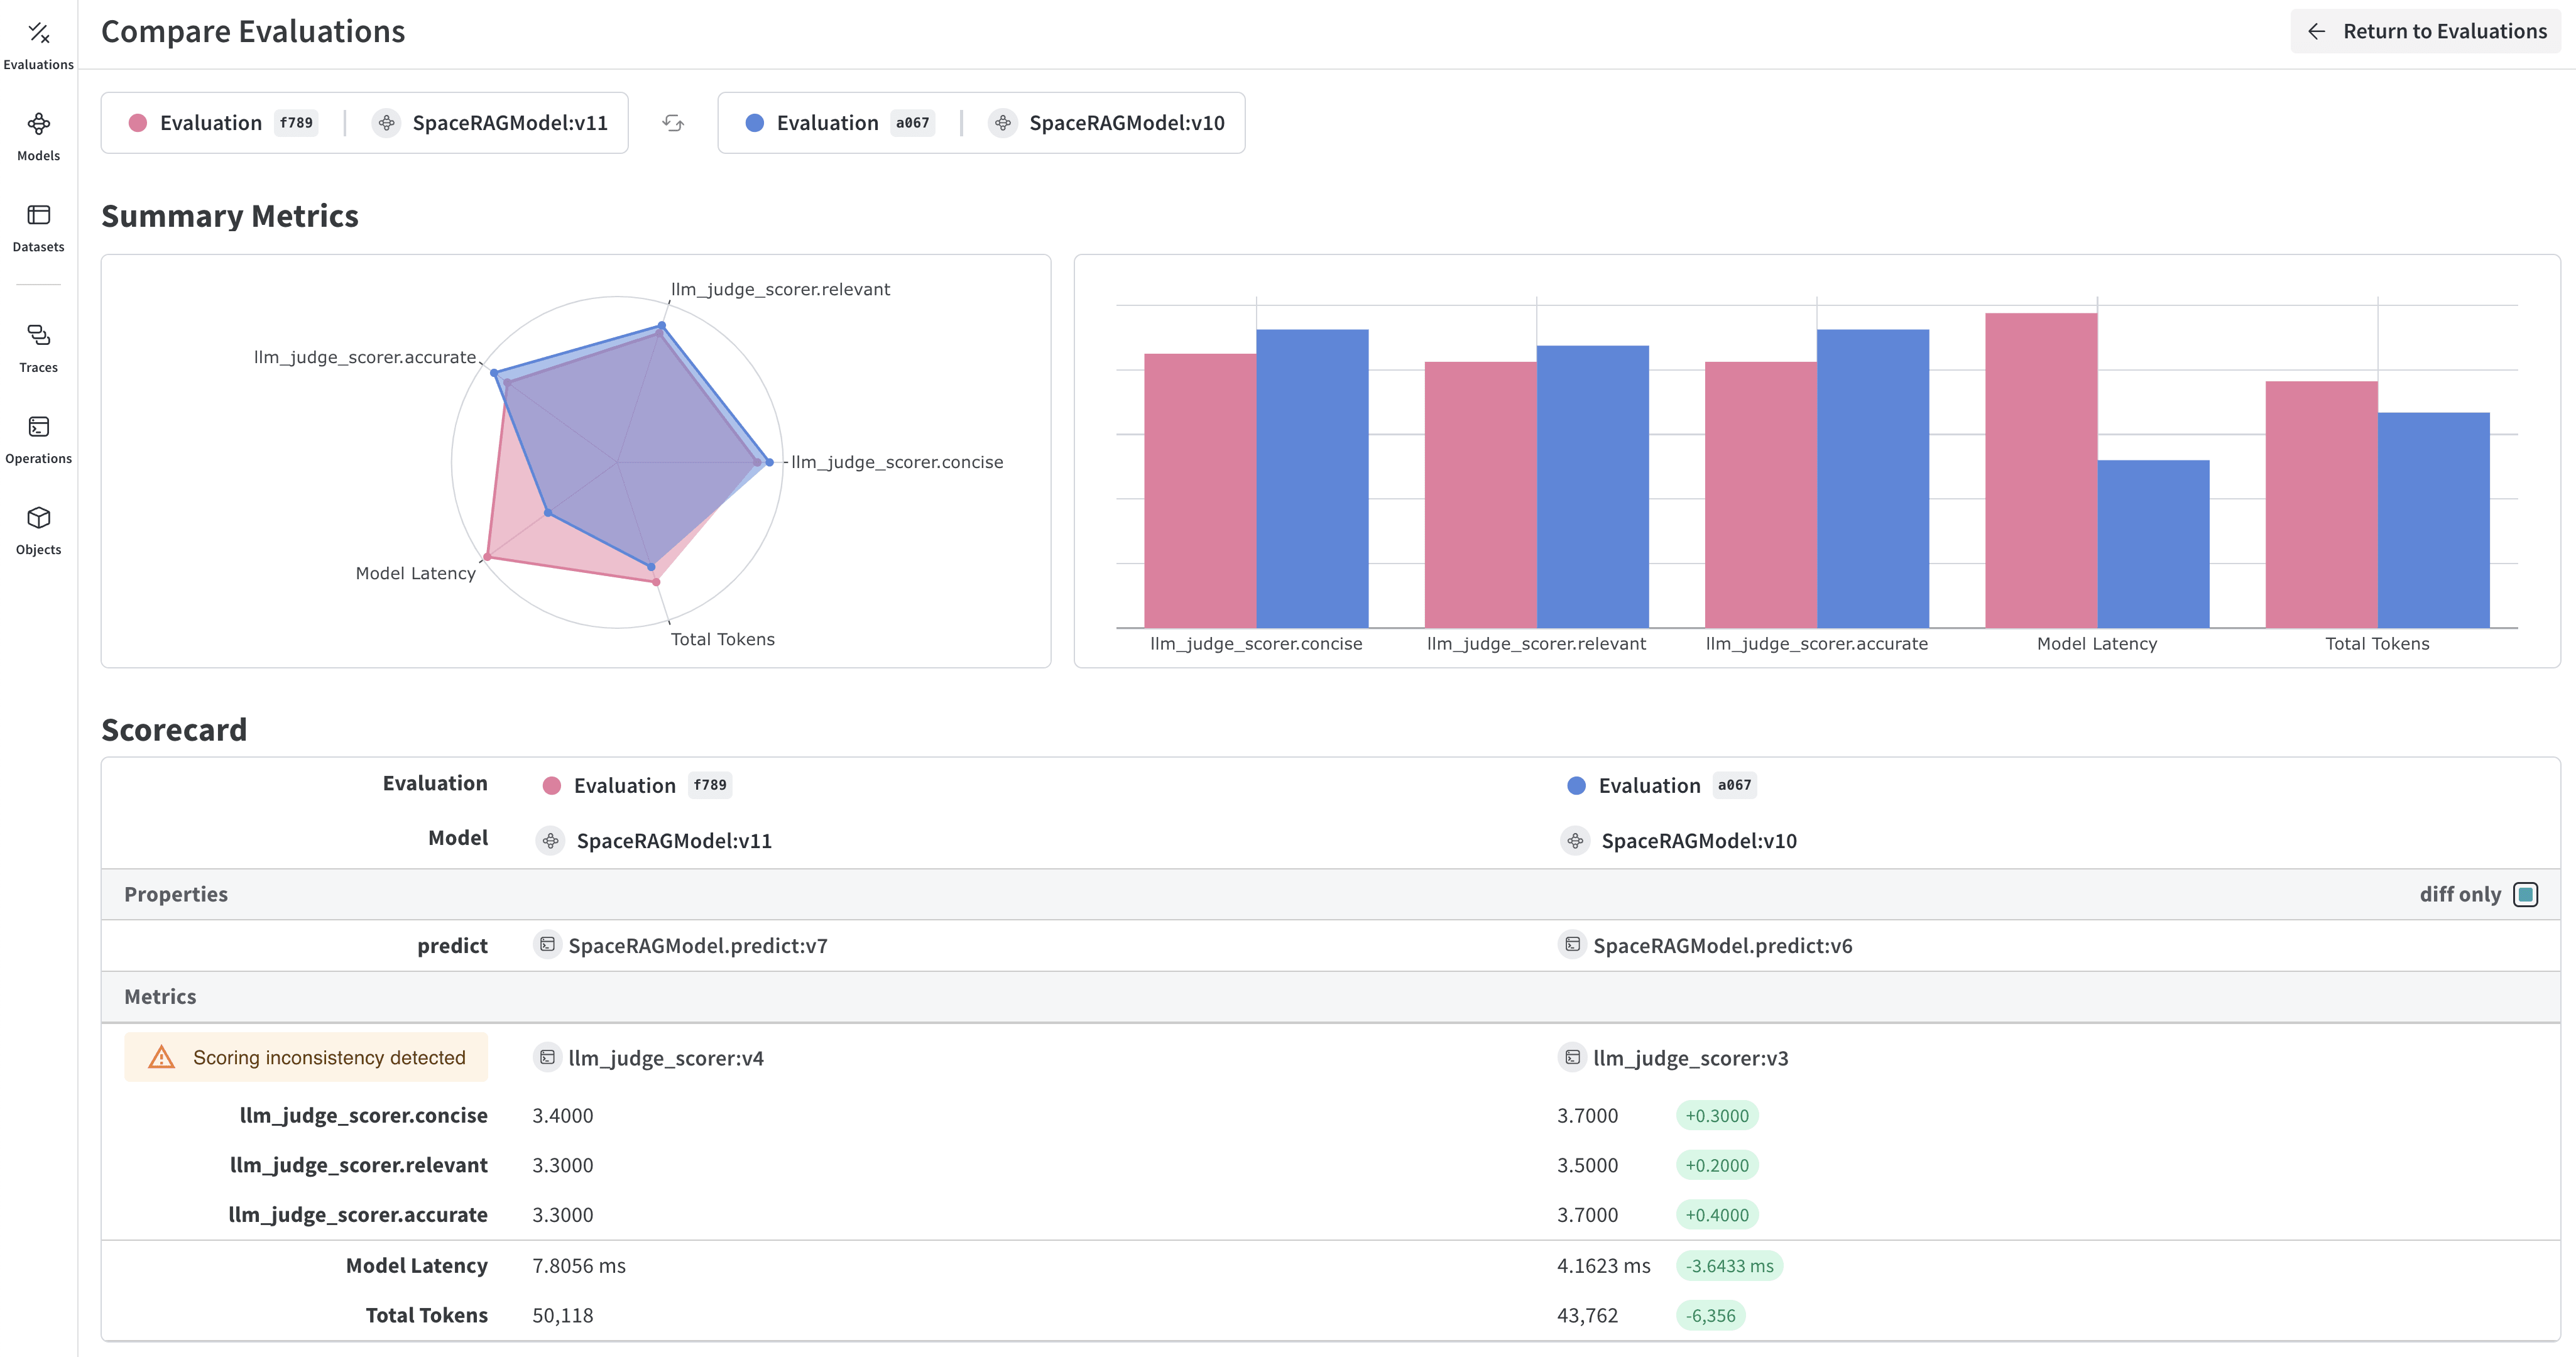
Key features for model evaluation
- Scorers and judges: Pre-built and custom evaluation metrics for accuracy, relevance, coherence, and more
- Evaluation datasets: Structured test sets with ground truth for systematic evaluation
- Model versioning: Track and compare different versions of your models
- Detailed tracing: Debug model behavior with complete input/output traces
- Cost tracking: Monitor API costs and token usage across evaluations
Getting started: Evaluate a model from W&B Registry
Download a model from W&B Models Registry and evaluate it using Weave:Integrate Weave evaluations with W&B Models
The Models and Weave Integration Demo shows the complete workflow for:- Load models from Registry: Download fine-tuned models stored in W&B Models Registry
- Create evaluation pipelines: Build comprehensive evaluations with custom scorers
- Log results back to W&B: Connect evaluation metrics to your model runs
- Version evaluated models: Save improved models back to the Registry
Advanced Weave features
Custom scorers and judges
Create sophisticated evaluation metrics tailored to your use case:Batch evaluations
Evaluate multiple model versions or configurations:Next steps
Evaluate models with tables
Use W&B Tables to:- Compare model predictions: View side-by-side comparisons of how different models perform on the same test set
- Track prediction changes: Monitor how predictions evolve across training epochs or model versions
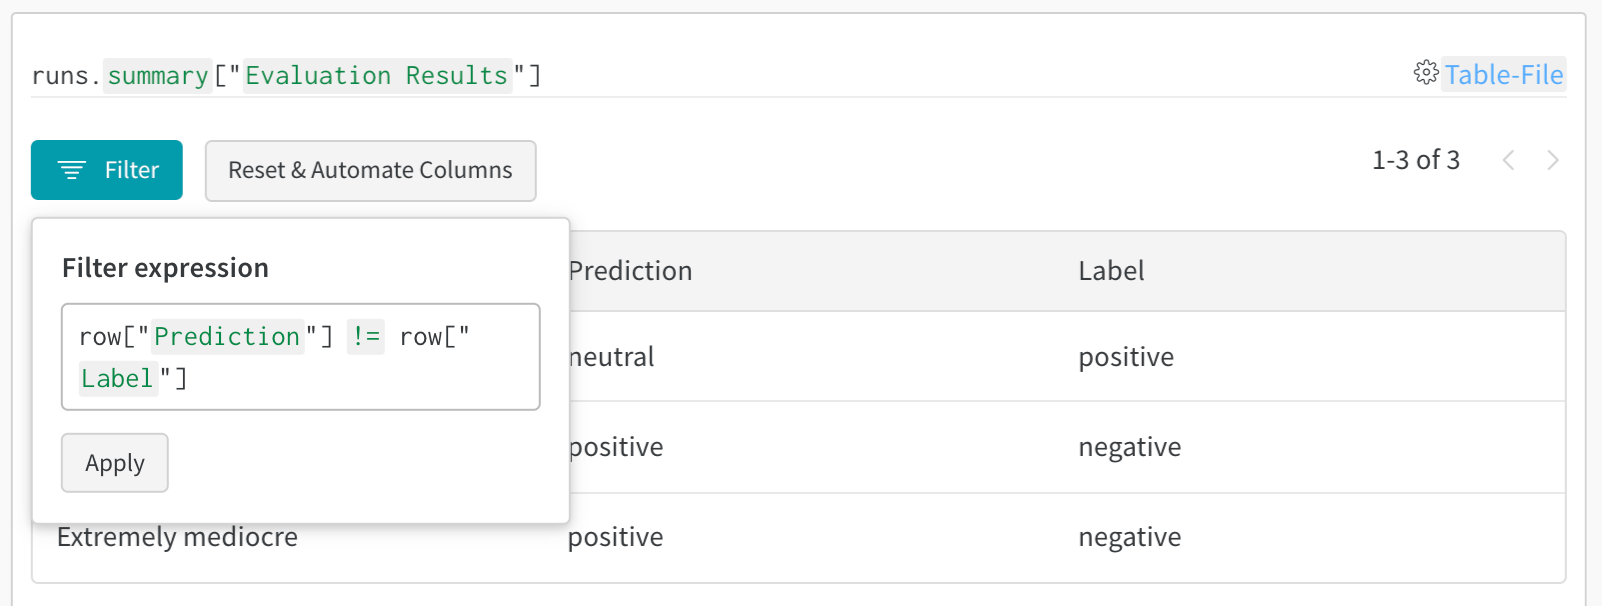
- Analyze errors: Filter and query to find commonly misclassified examples and error patterns
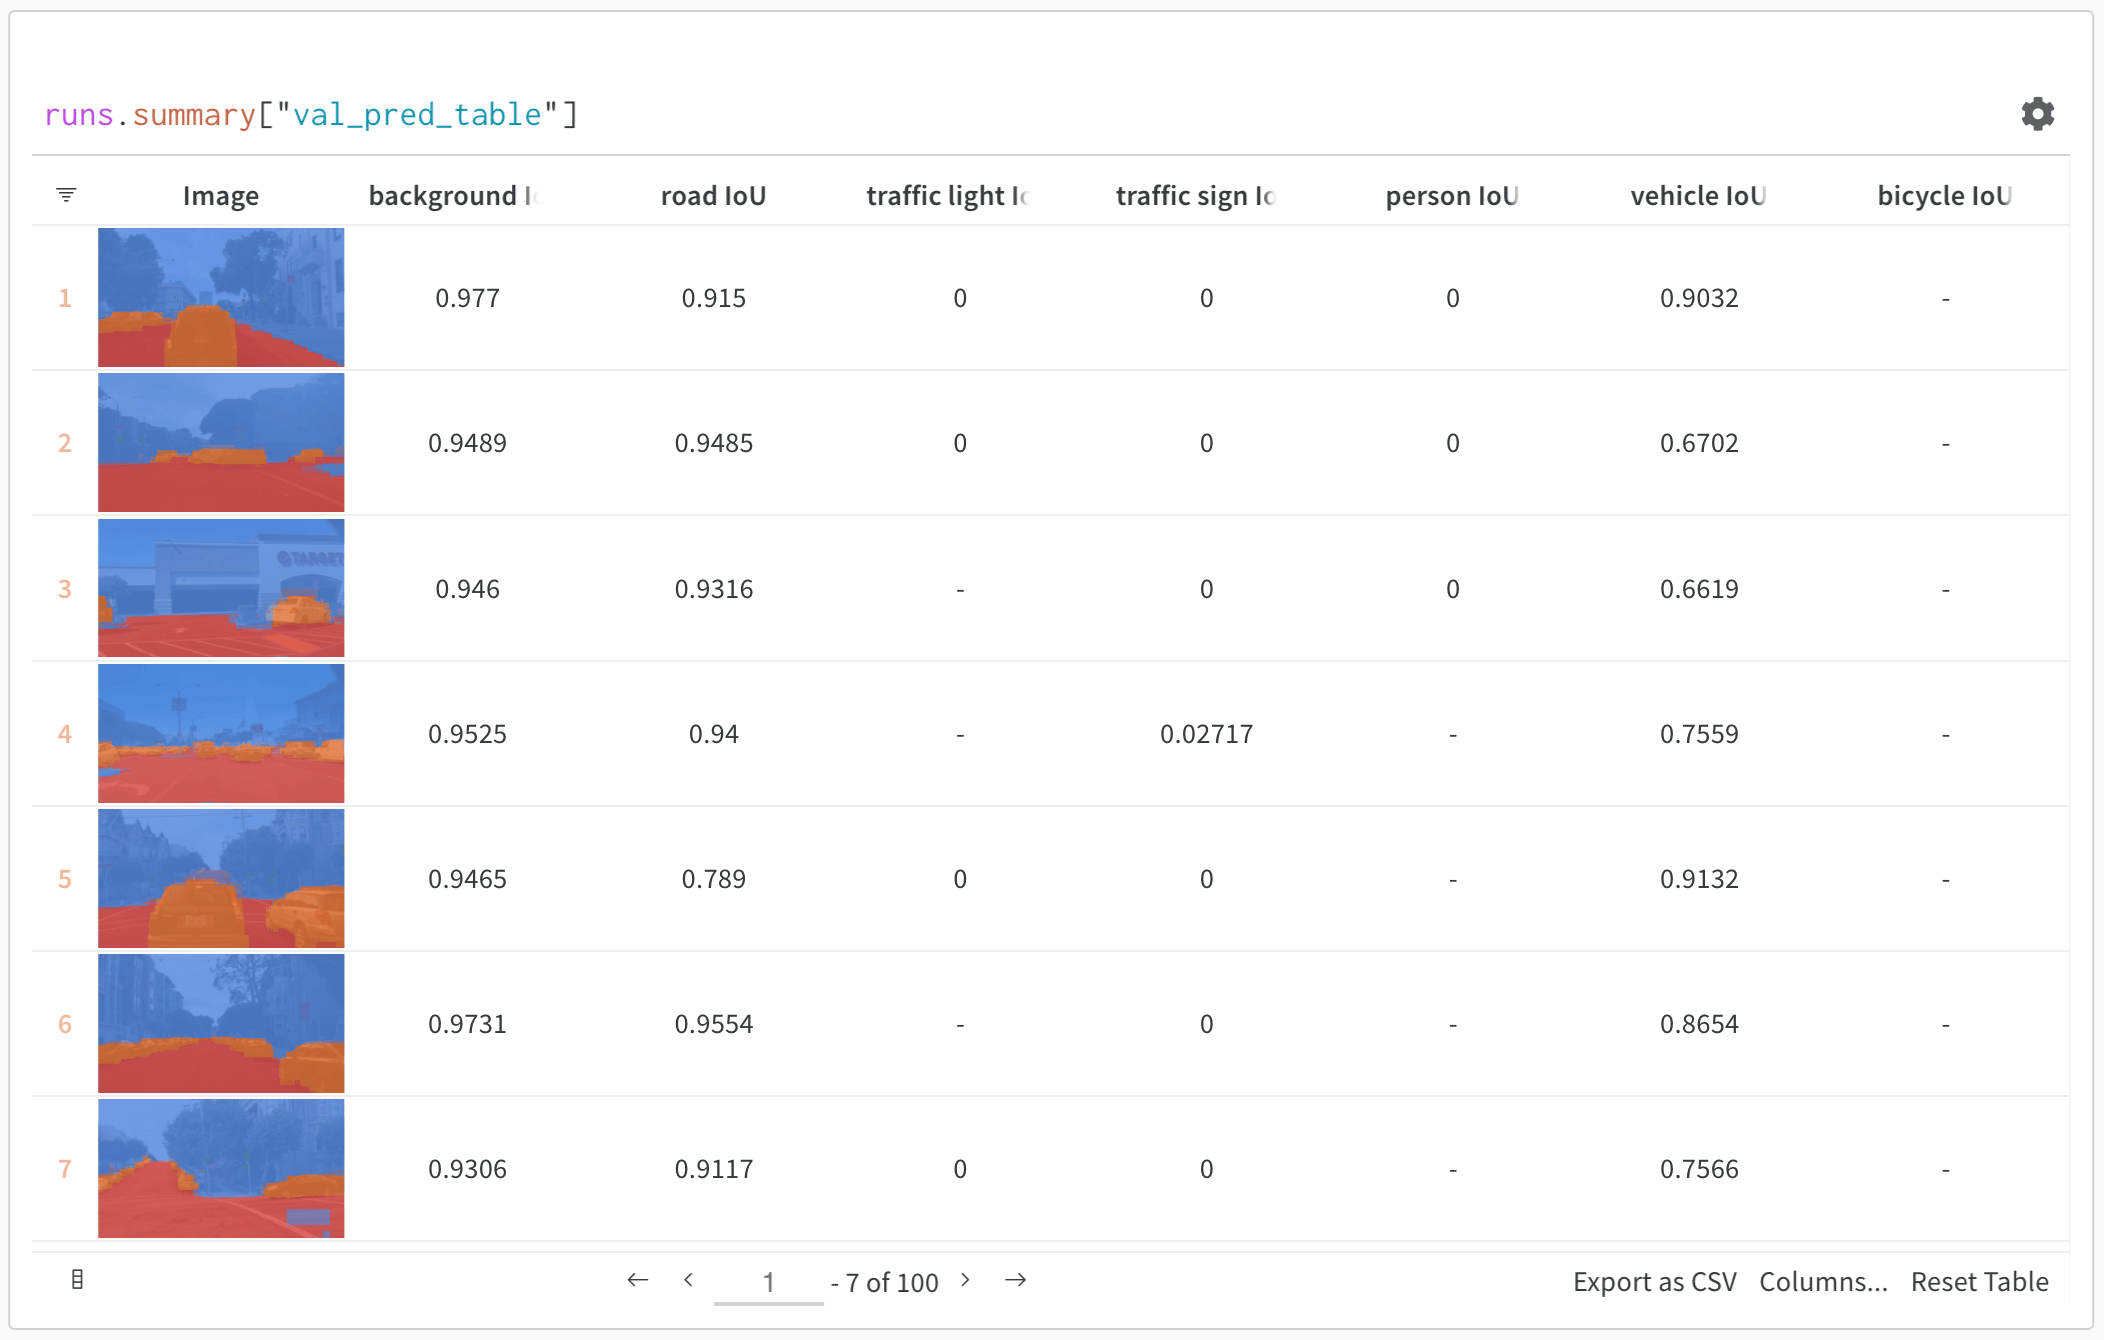
- Visualize rich media: Display images, audio, text, and other media types alongside predictions and metrics
Basic example: Log evaluation results
Advanced table workflows
Compare multiple models
Log evaluation tables from different models to the same key for direct comparison: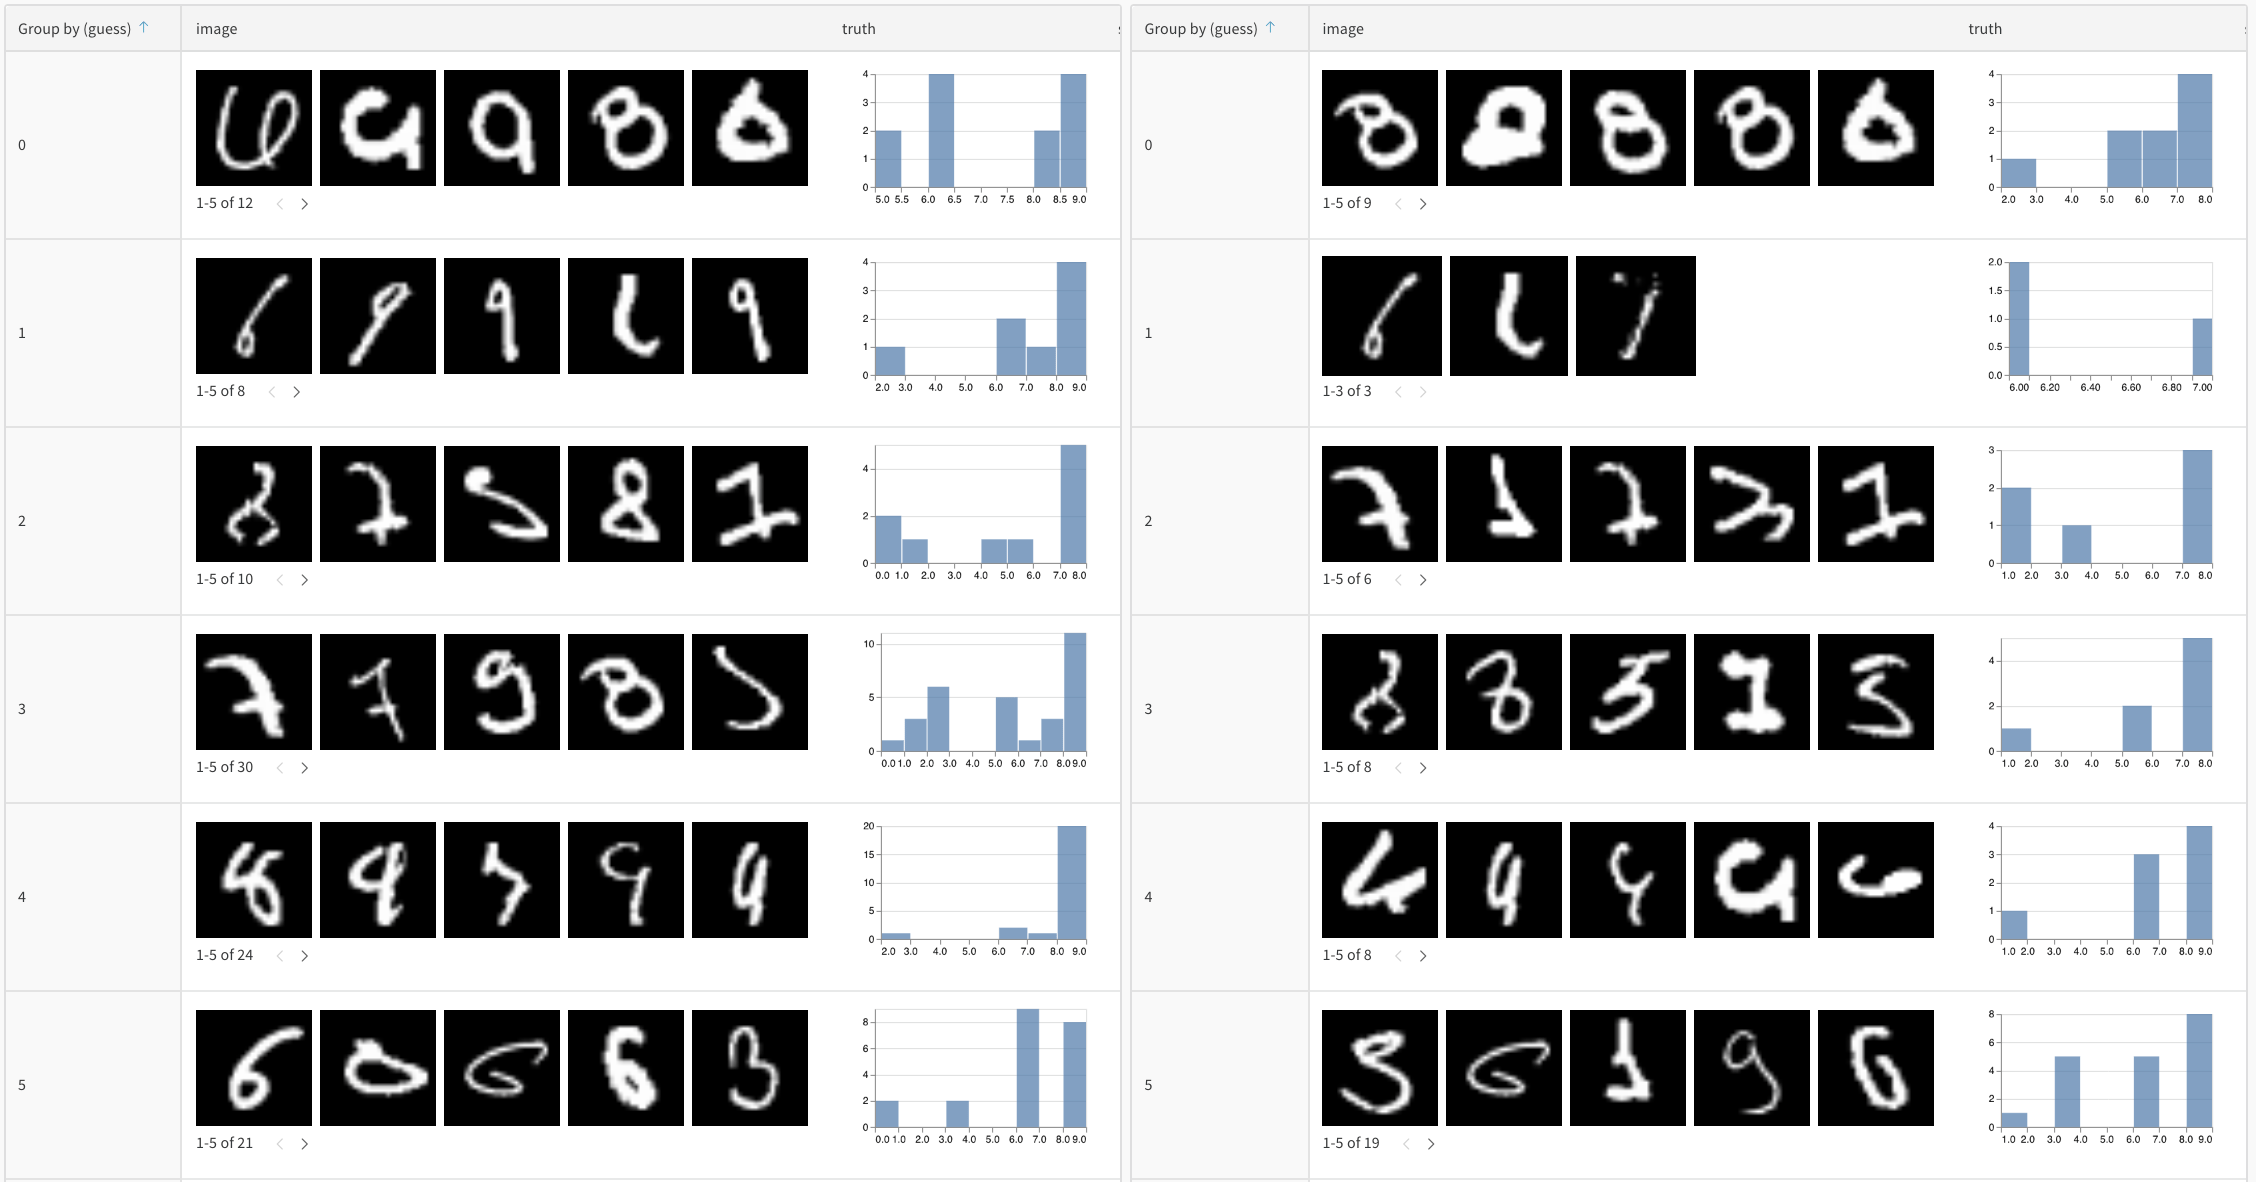
Track predictions over time
Log tables at different training epochs to visualize improvement:Interactive analysis in the W&B UI
Once logged, you can:- Filter results: Click on column headers to filter by prediction accuracy, confidence thresholds, or specific classes
- Compare tables: Select multiple table versions to see side-by-side comparisons
- Query data: Use the query bar to find specific patterns (for example,
"correct" = false AND "confidence" > 0.8) - Group and aggregate: Group by predicted class to see per-class accuracy metrics