Workspace settings
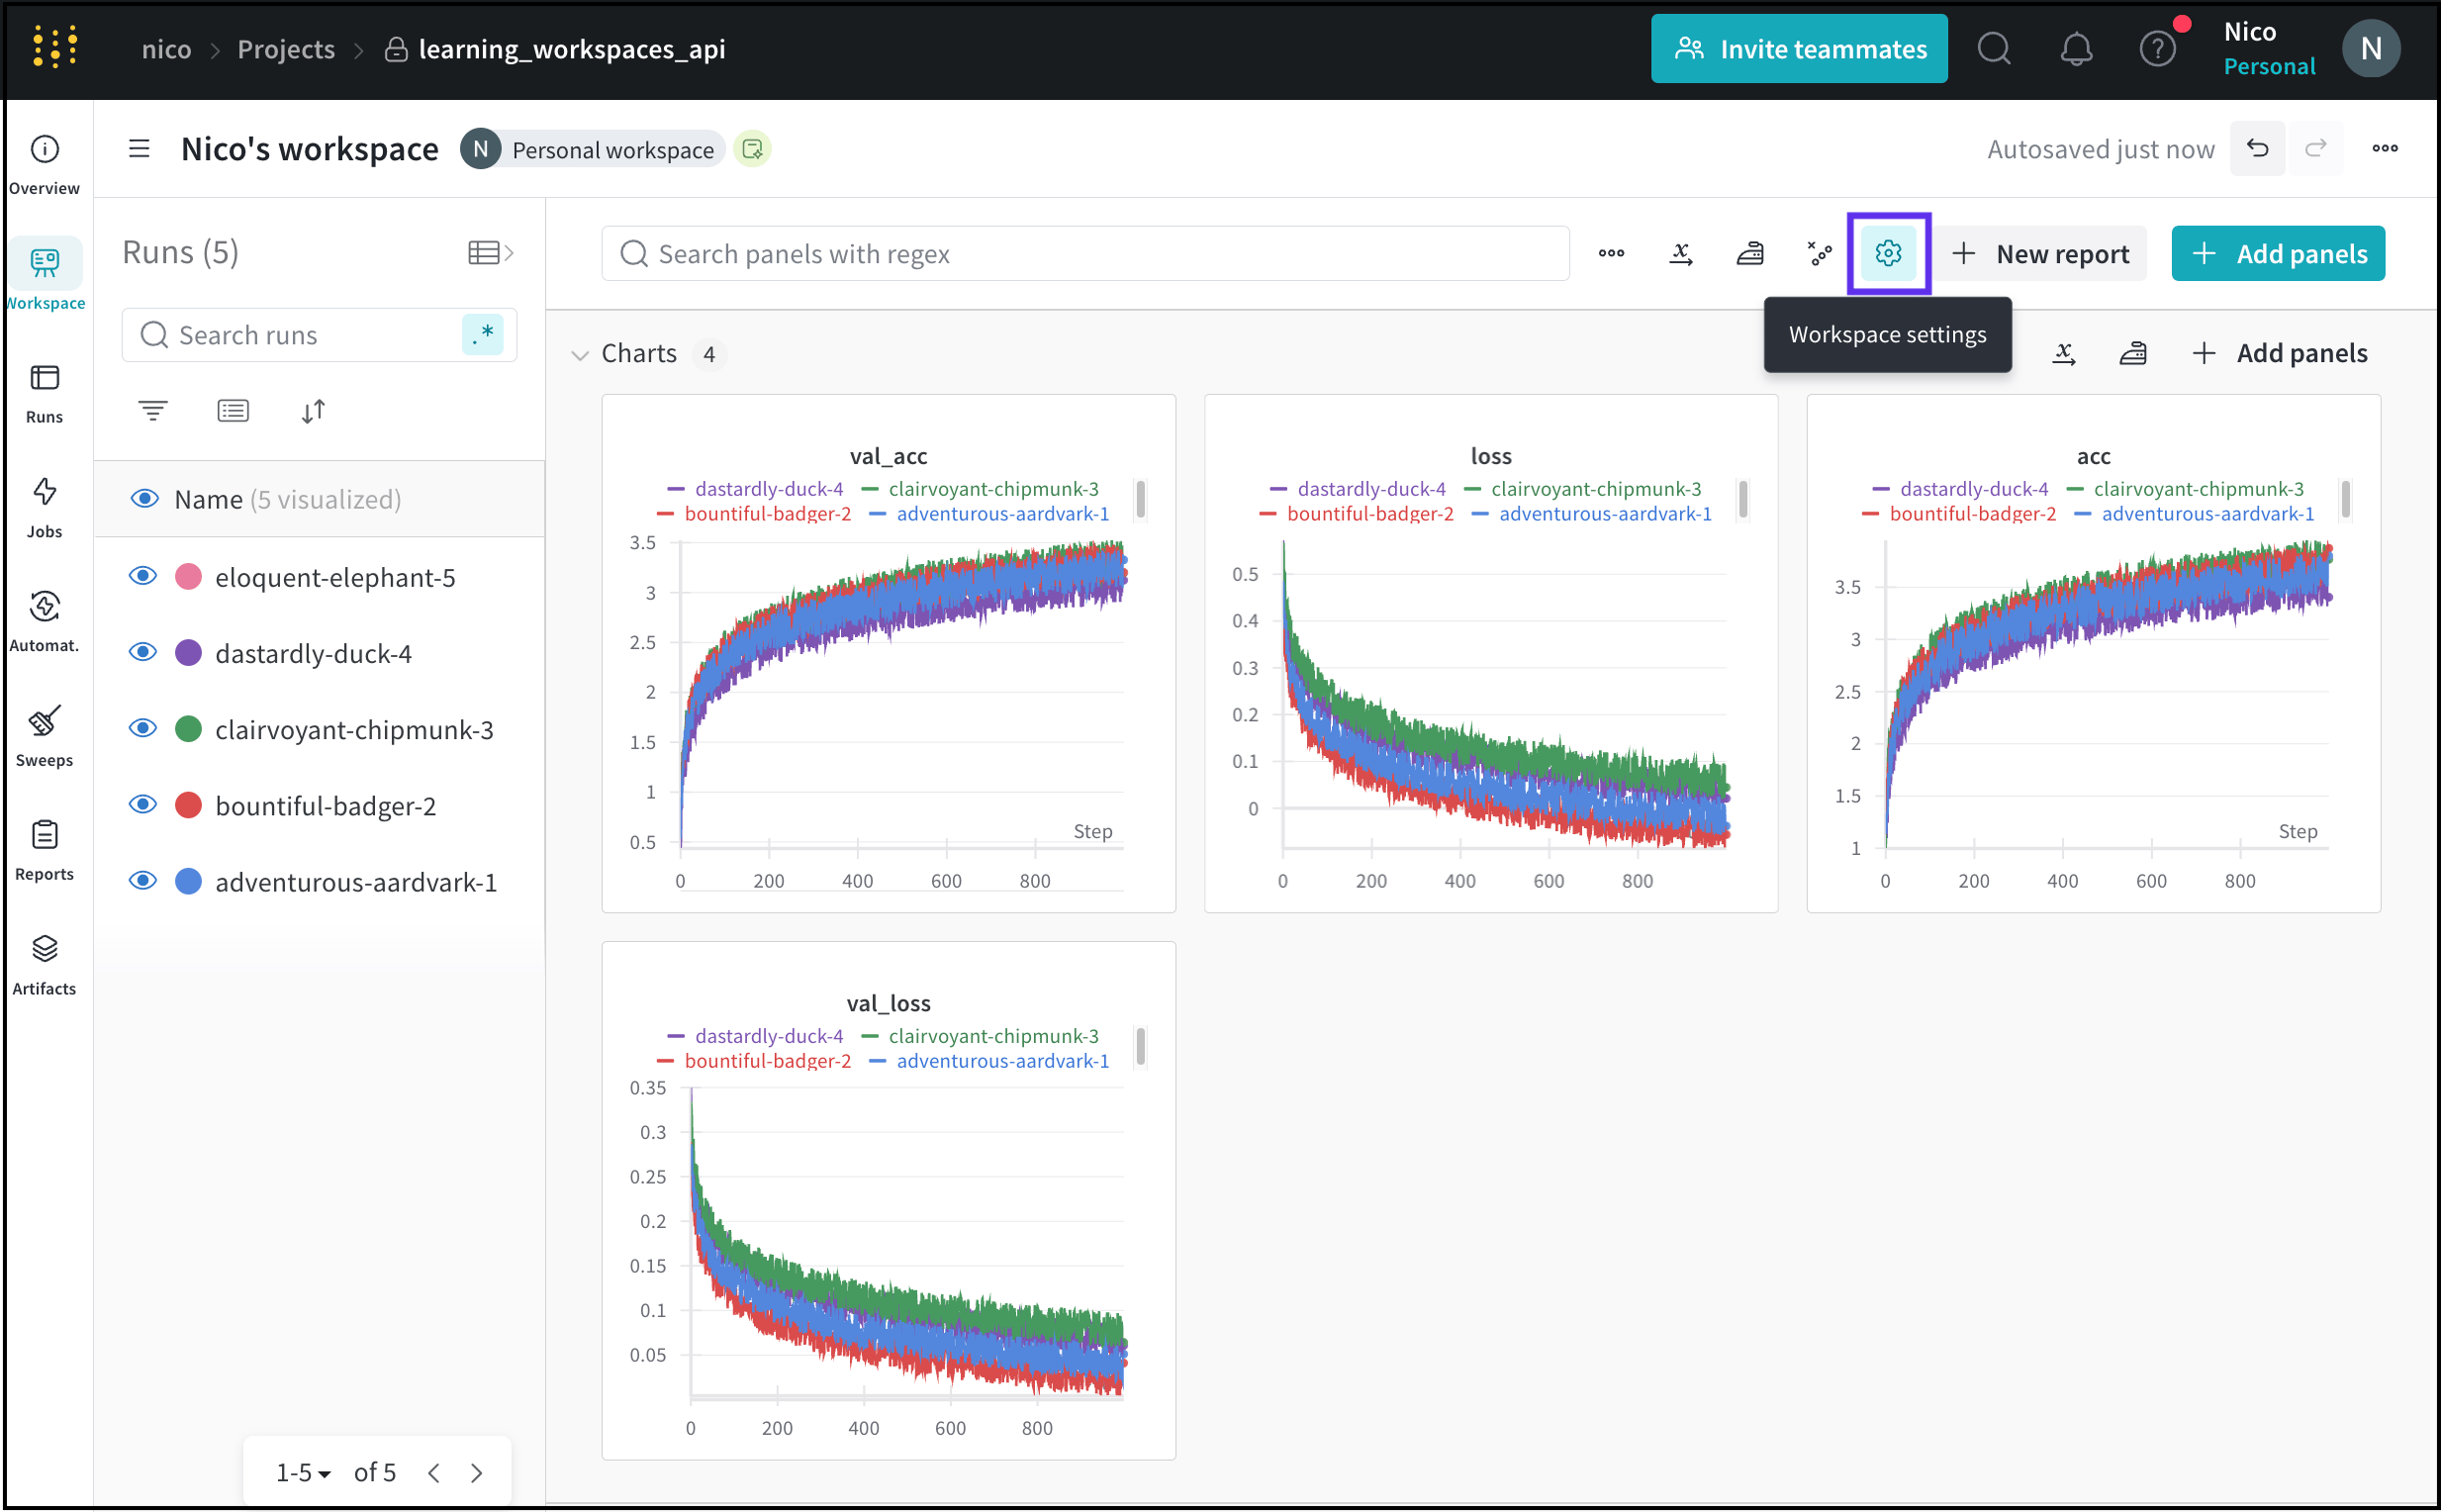
Workspace settings apply to all sections and all panels within those sections. You can edit two types of workspace settings: Workspace layout and Line plots. Workspace layouts determine the structure of the workspace, while Line plots settings control the default settings for line plots in the workspace. To edit settings that apply to the overall structure of this workspace:- Navigate to your project workspace.
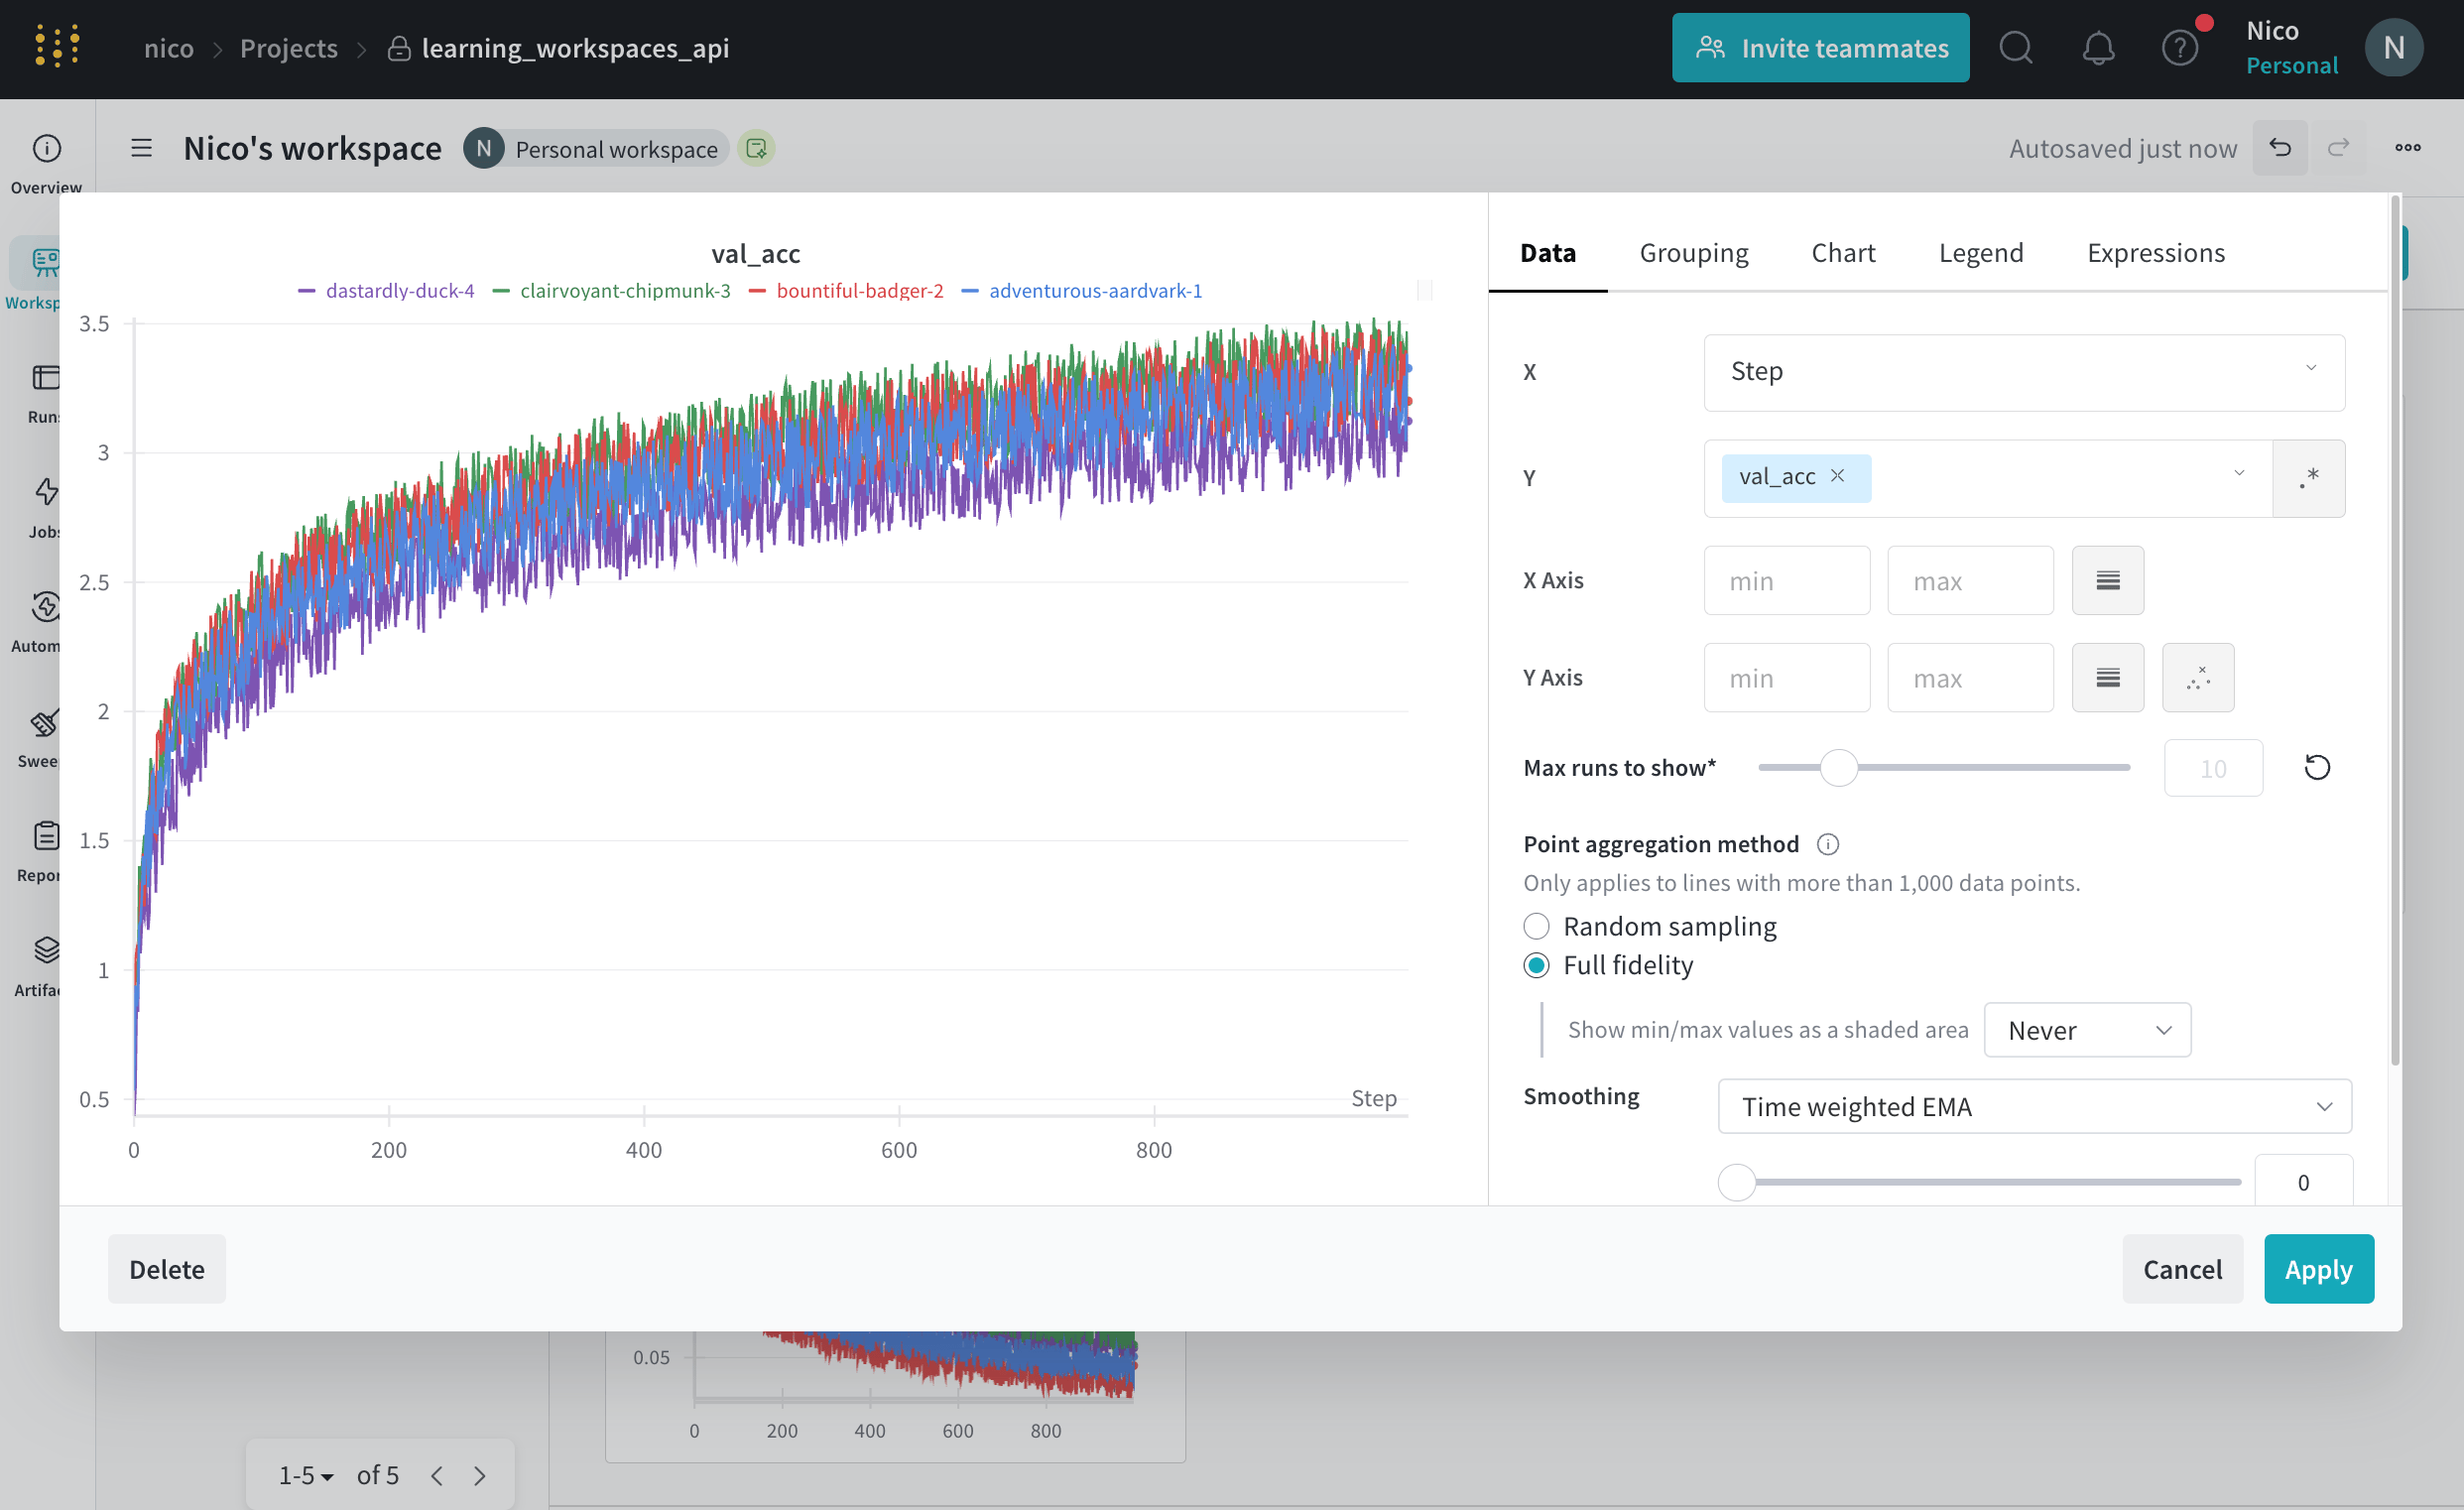
- Click the gear icon next to the New report button to view the workspace settings.
- Choose Workspace layout to change the workspace’s layout, or choose Line plots to configure default settings for line plots in the workspace.
After customizing your workspace, you can use workspace templates to create new workspaces with the same settings. Refer to Workspace templates.
Workspace layout options
Configure a workspace’s layout to define the overall structure of the workspace. This includes sectioning logic and panel organization.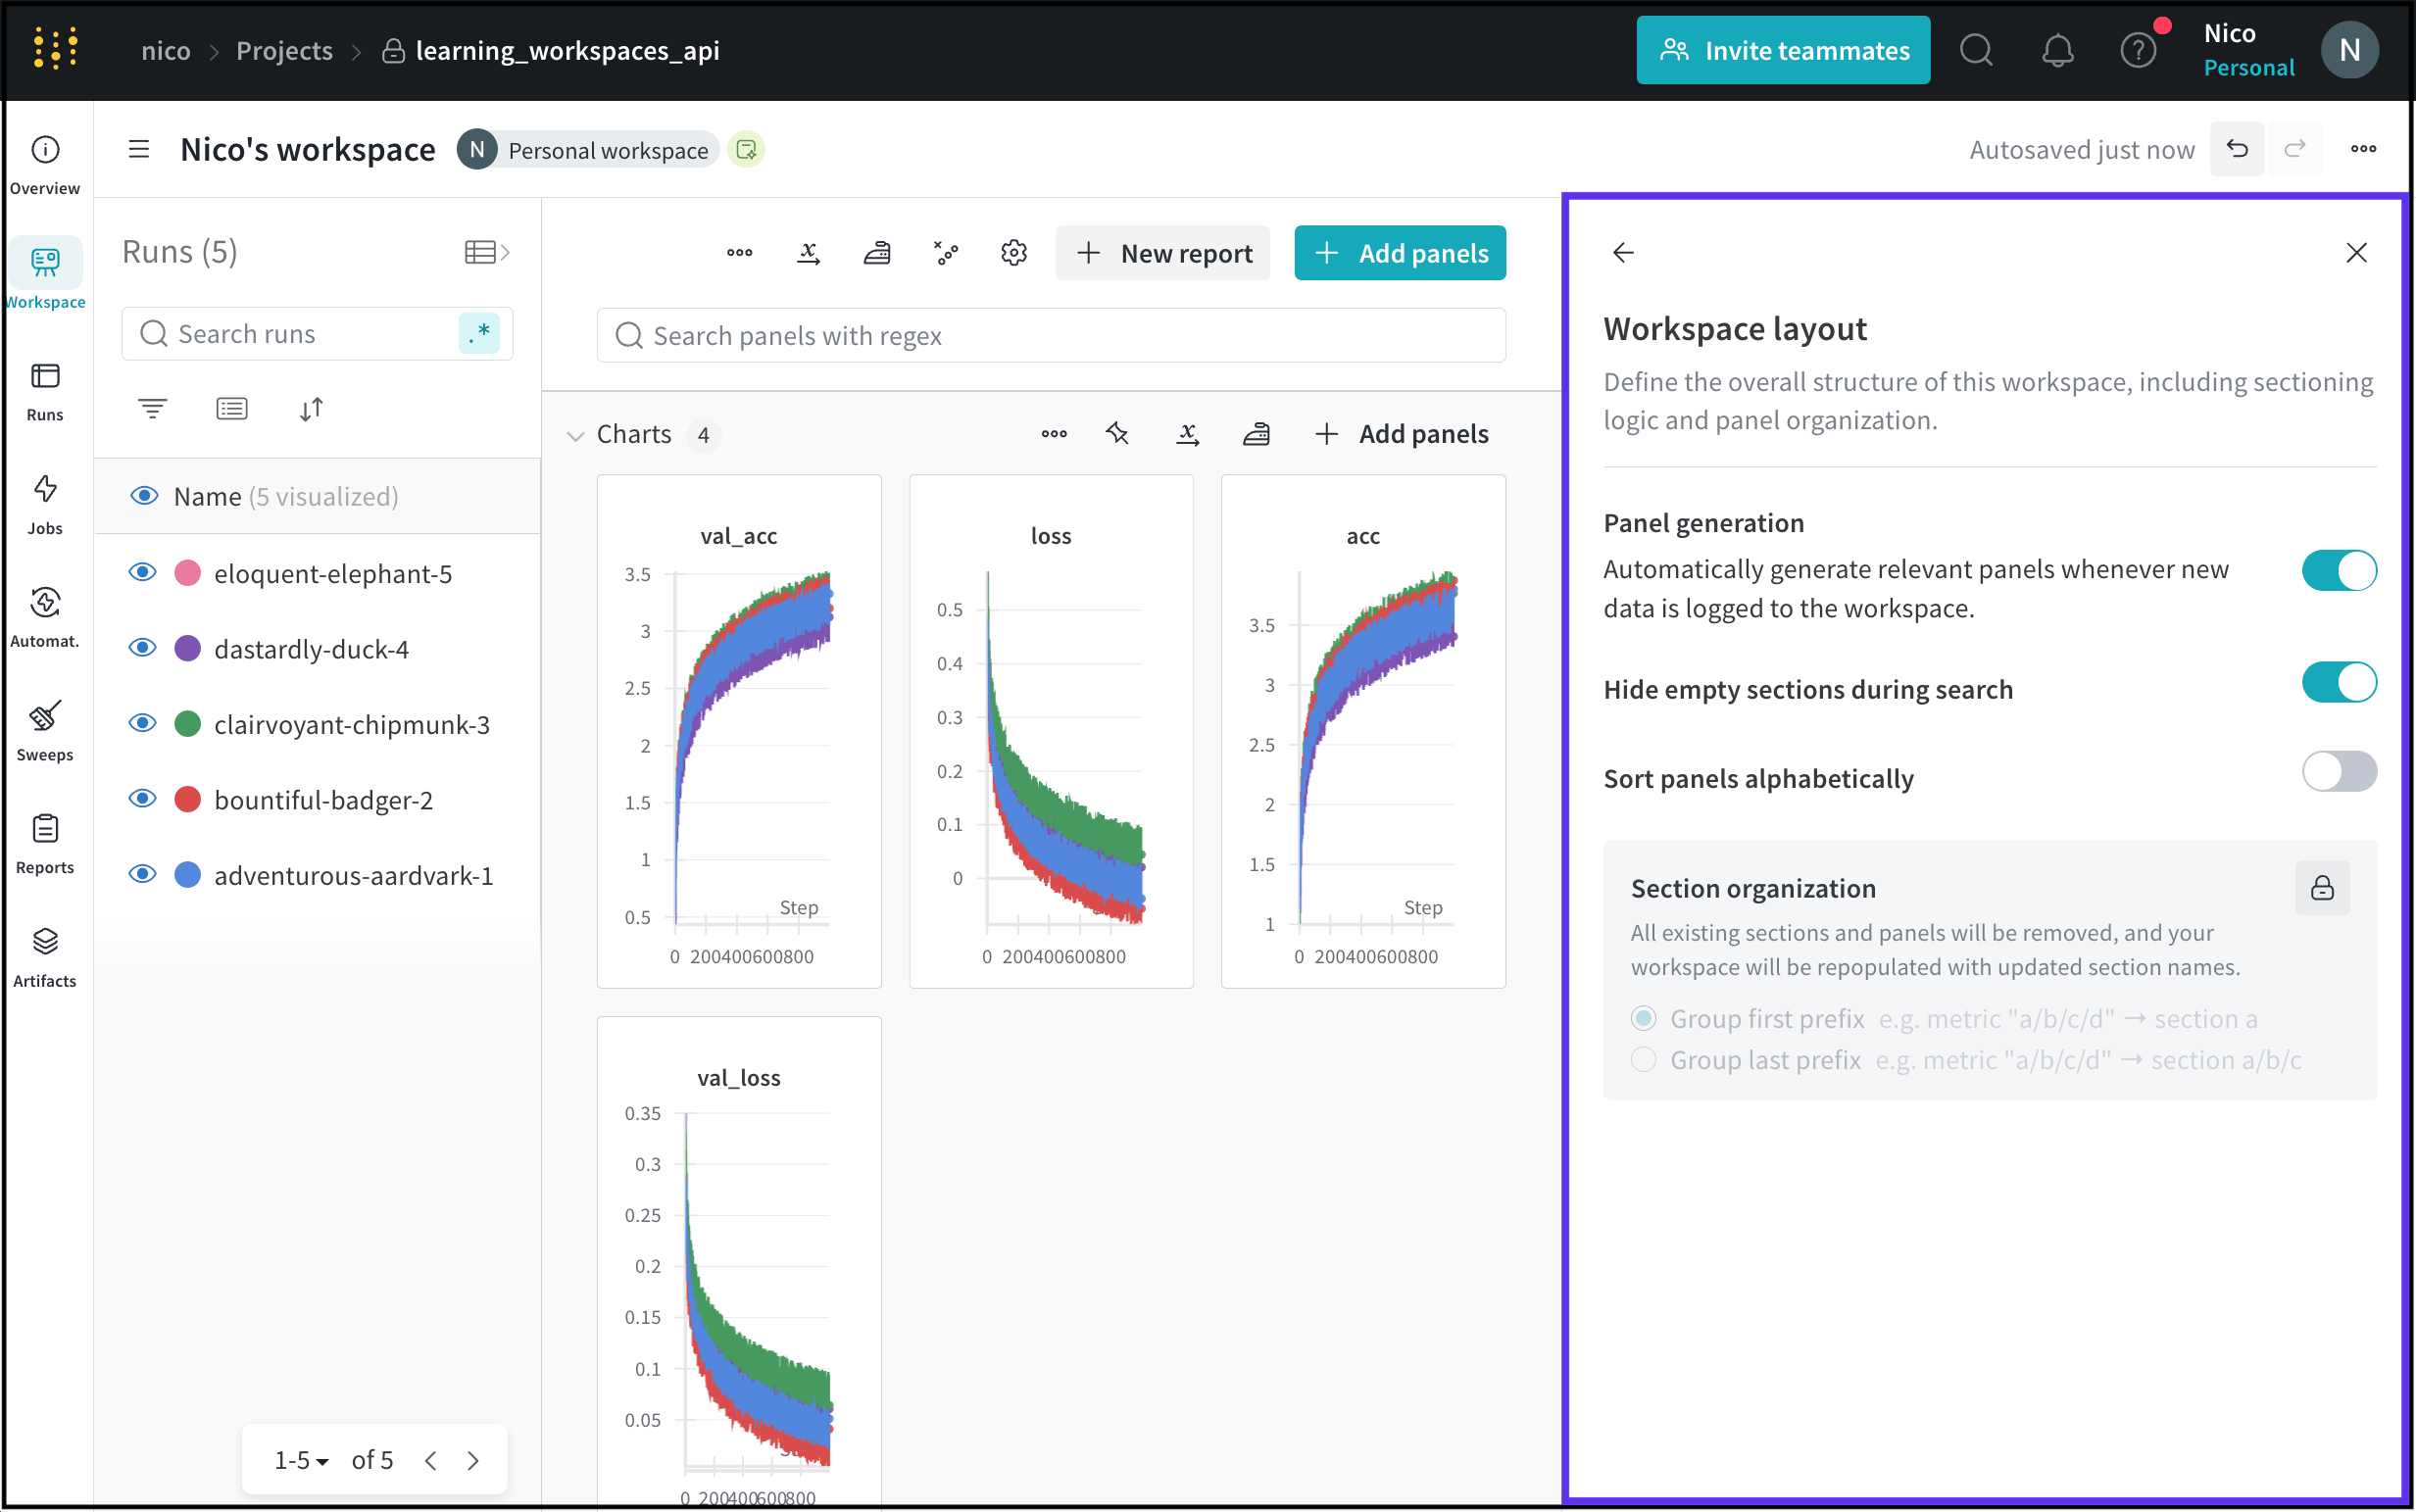
W&B suggests that you organize sections by grouping the first prefix rather than grouping by the last prefix. Grouping by the first prefix can result in fewer sections and better performance.
Line plots options
Set global defaults and custom rules for line plots in a workspace by modifying the Line plots workspace settings.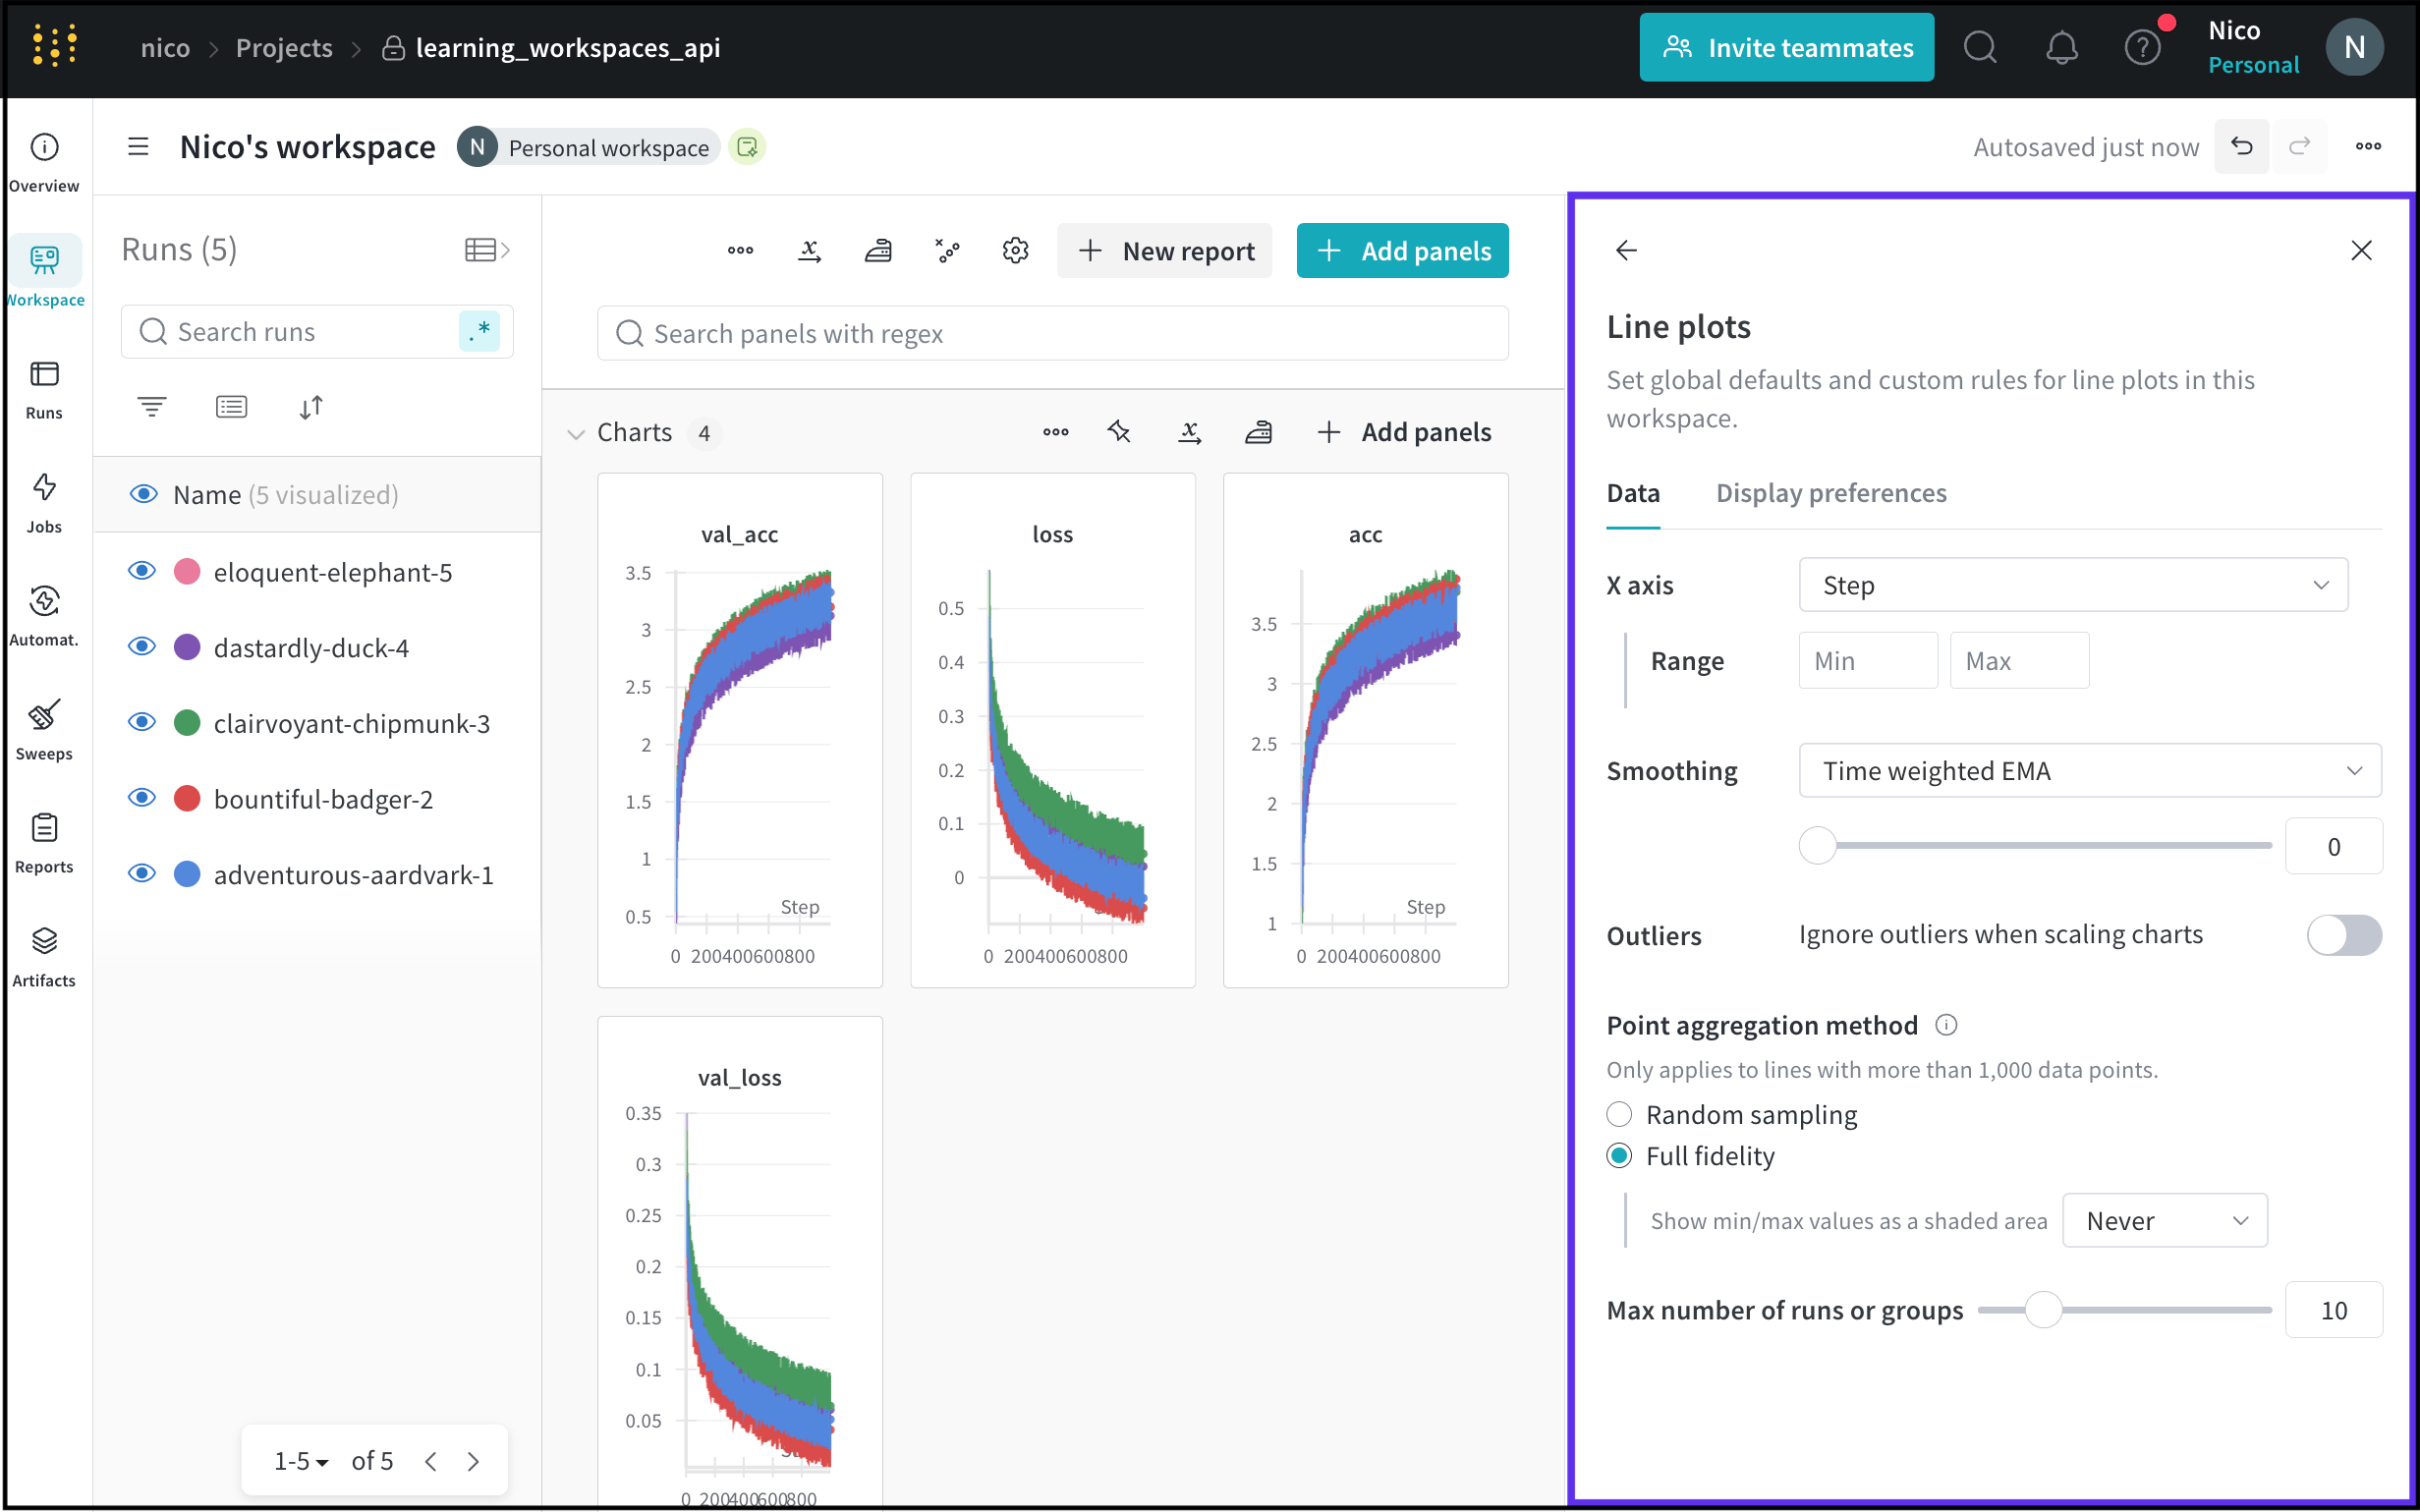
Besides Step, the x-axis supports the following options:
For information about how to edit an individual line plot, see Edit line panel settings in Line plots.
Section settings
Section settings apply to all panels within that section. Within a workspace section you can sort panels, rearrange panels, and rename the section name. To modify section settings, select the action () menu in the upper right corner of a section.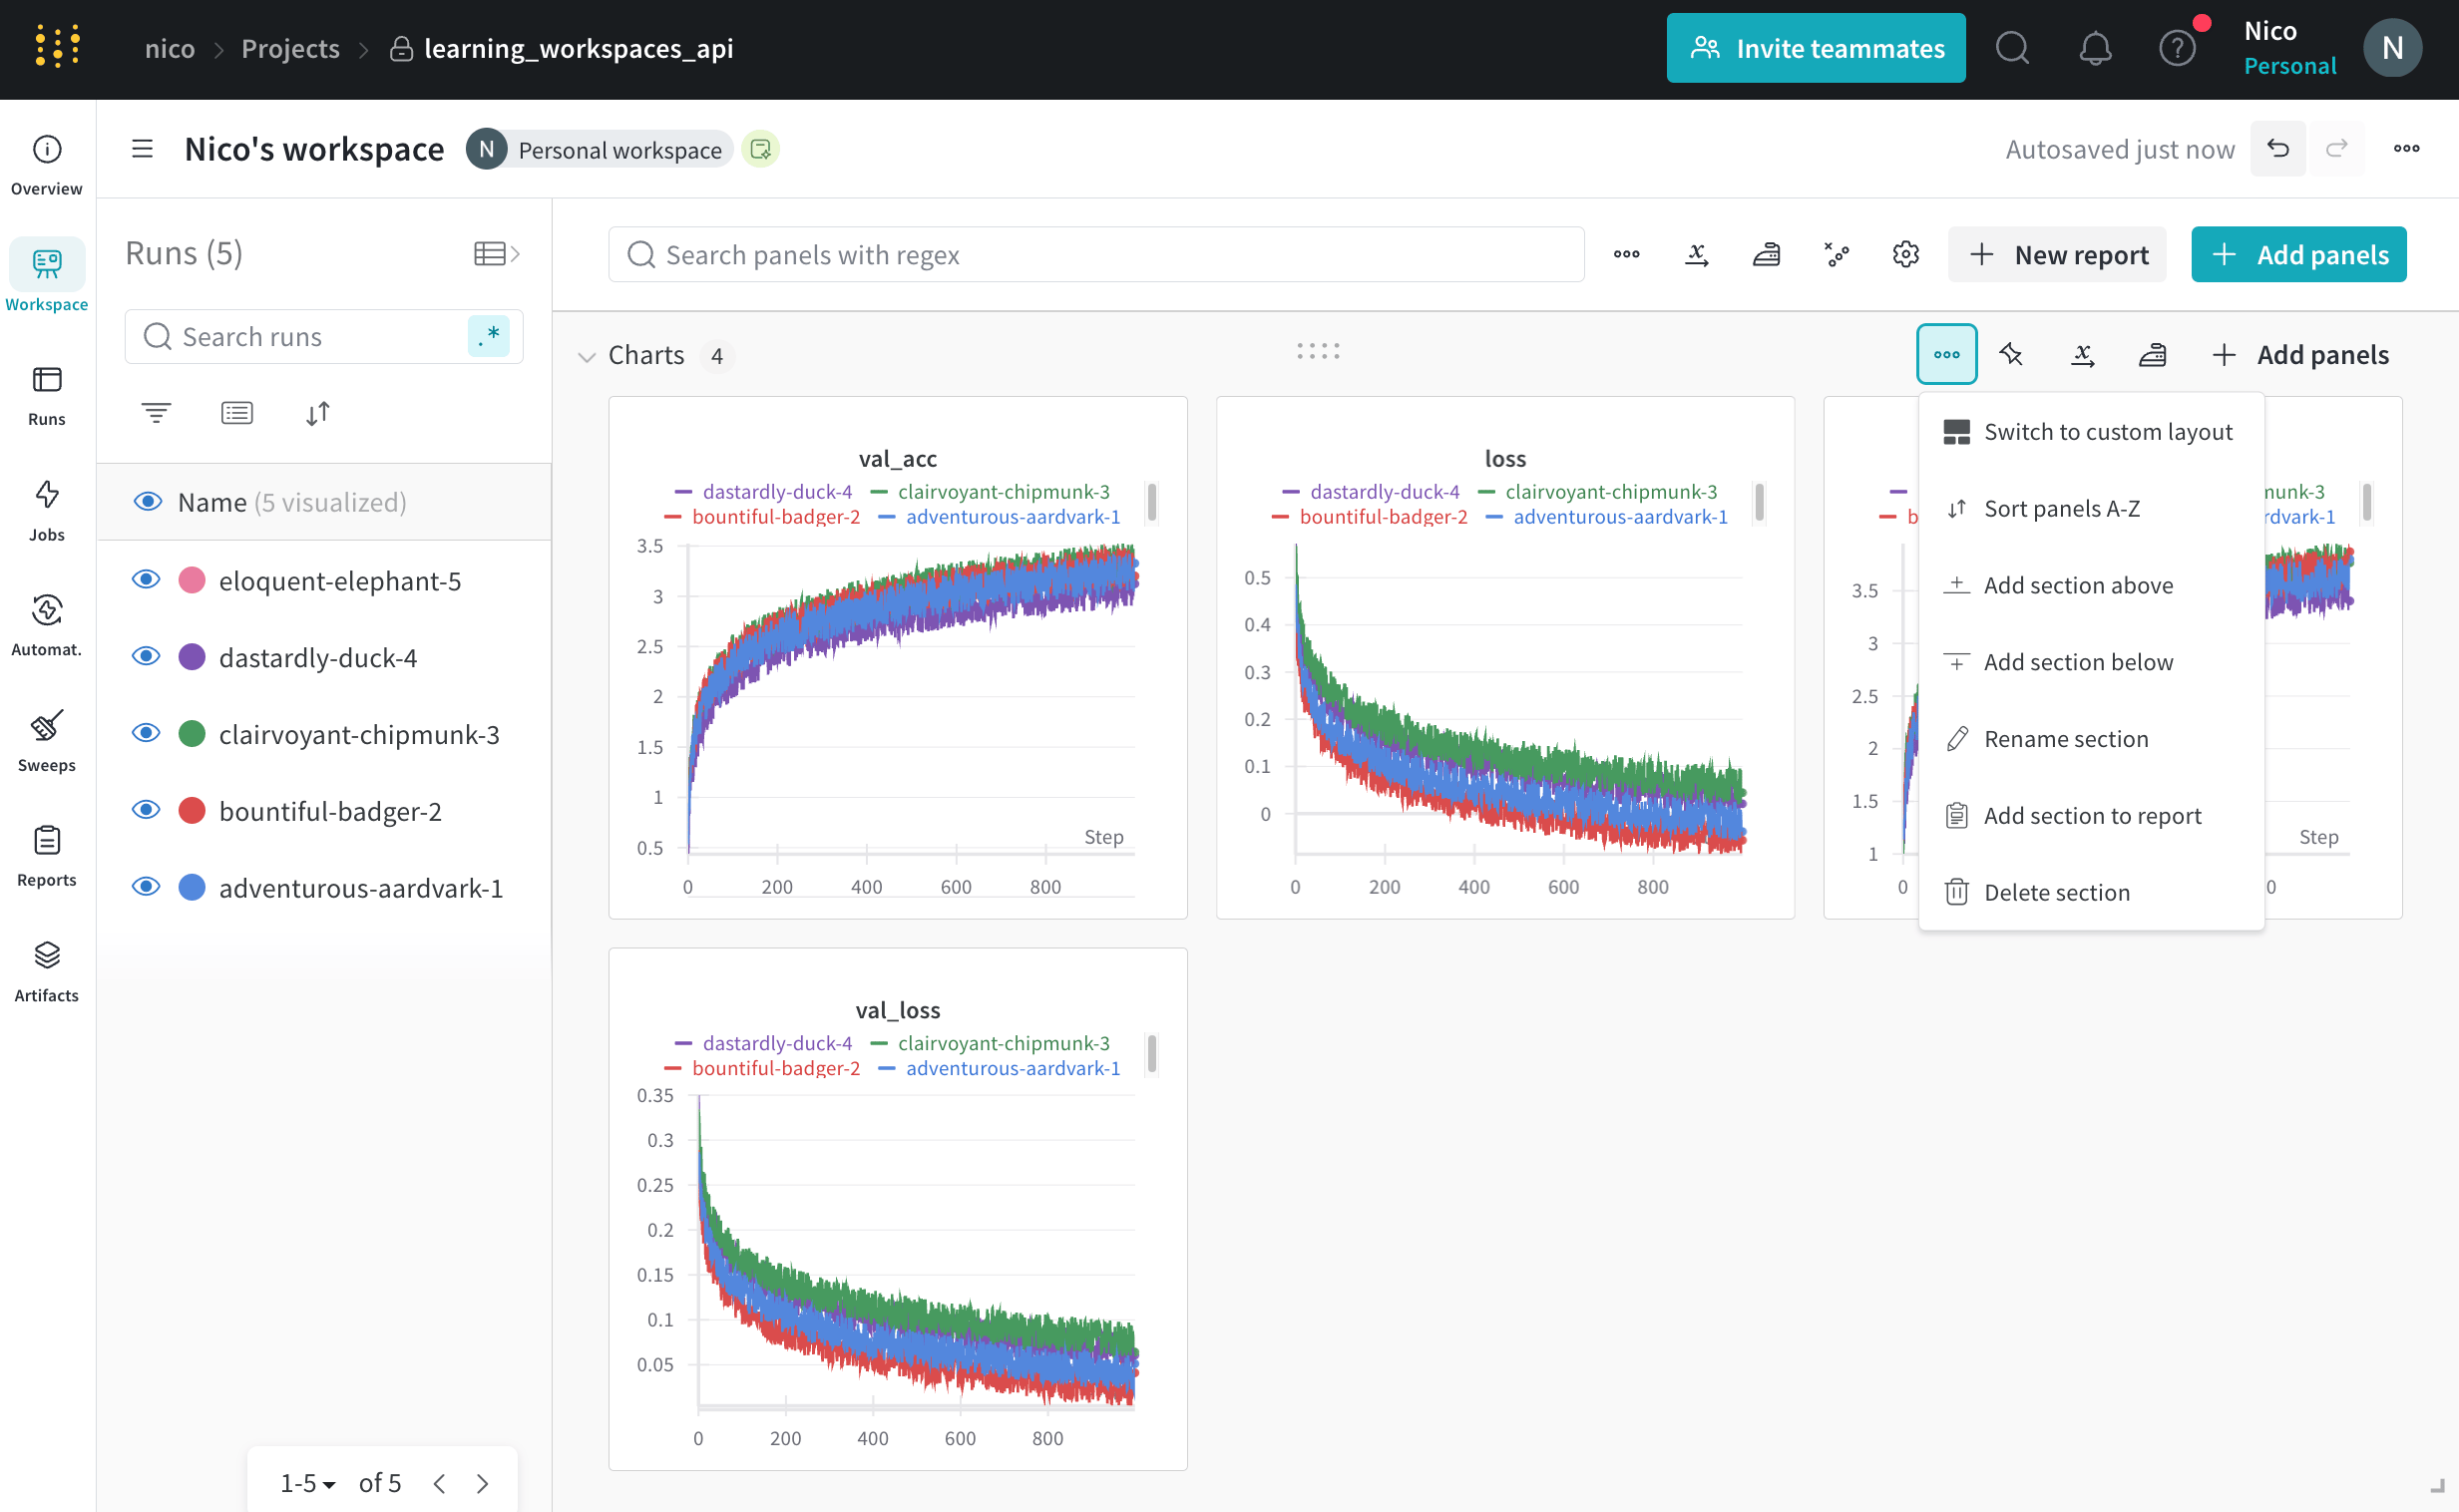
The following animation demonstrates how to rearrange panels within a section:
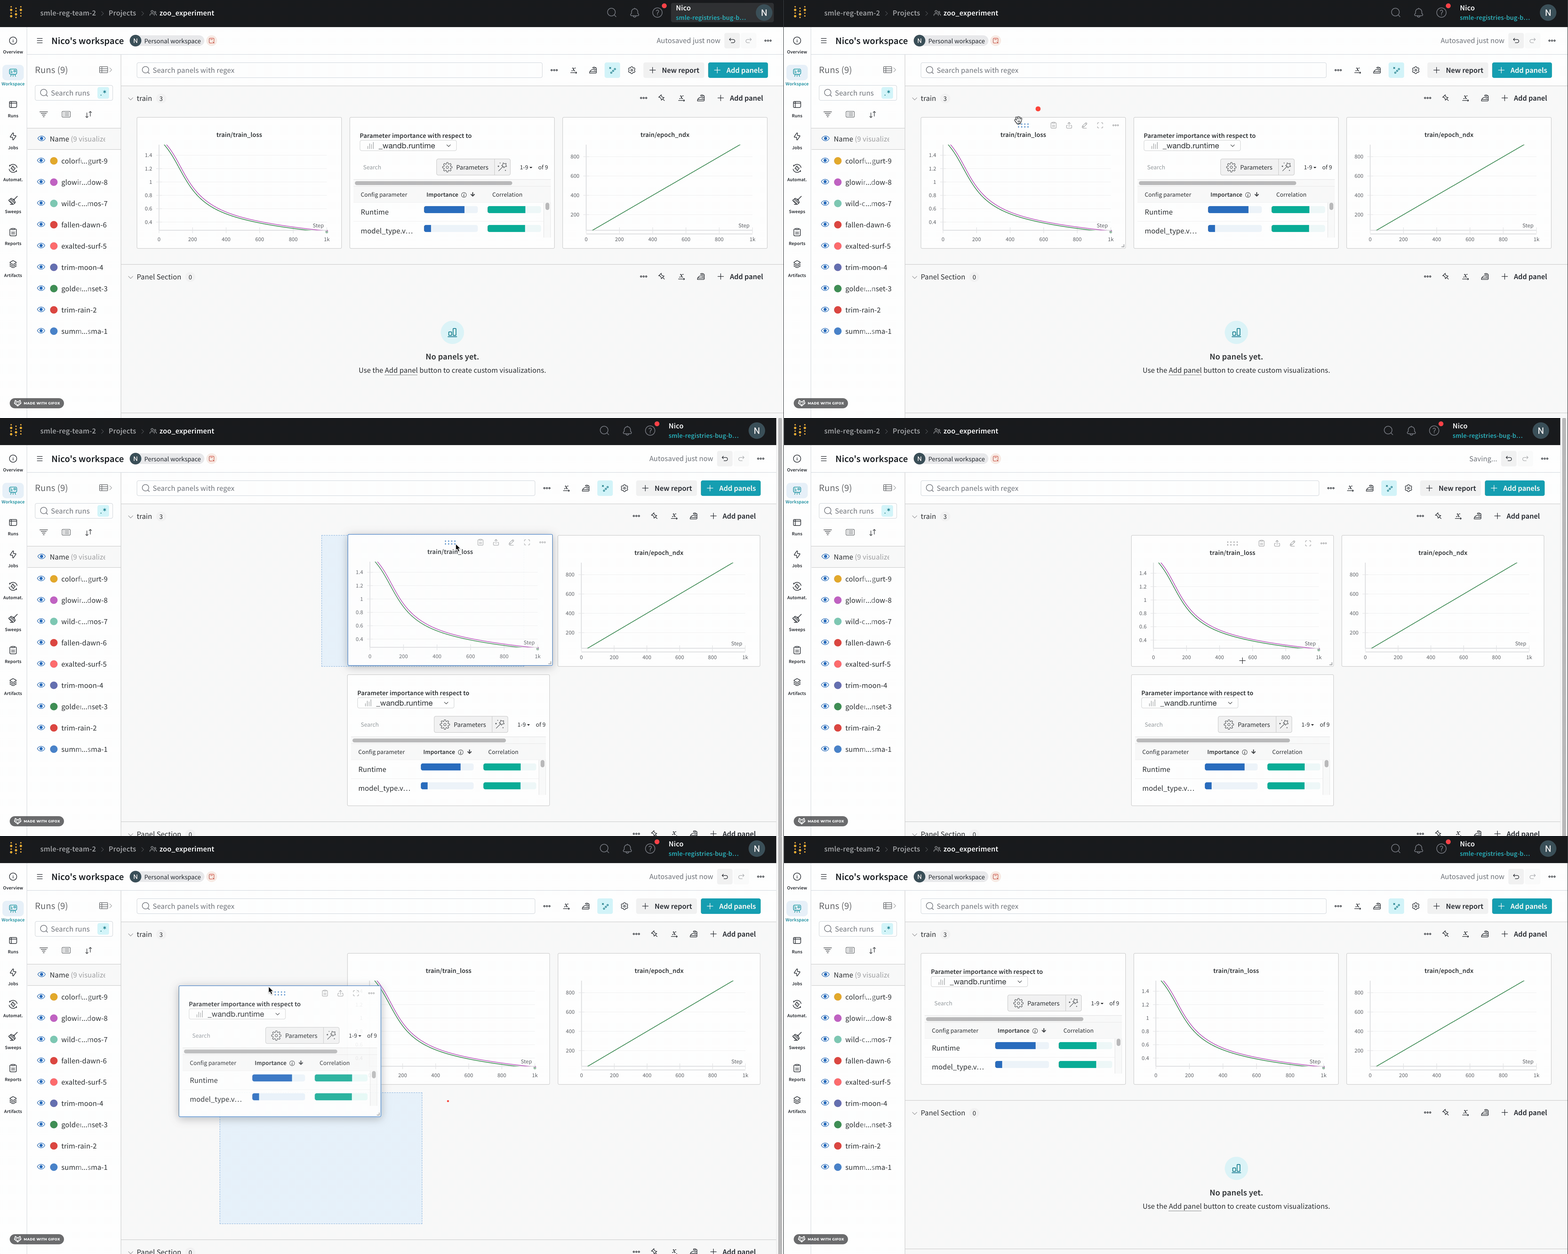
Besides the settings described in the preceding table, you can also edit how sections appear in your workspaces such as Add section below, Add section above, Delete section, and Add section to report.
Panel settings
Customize an individual panel’s settings to compare multiple lines on the same plot, calculate custom axes, rename labels, and more. To edit a panel’s settings:- Hover over the panel you want to edit.
- Select the pencil icon that appears.
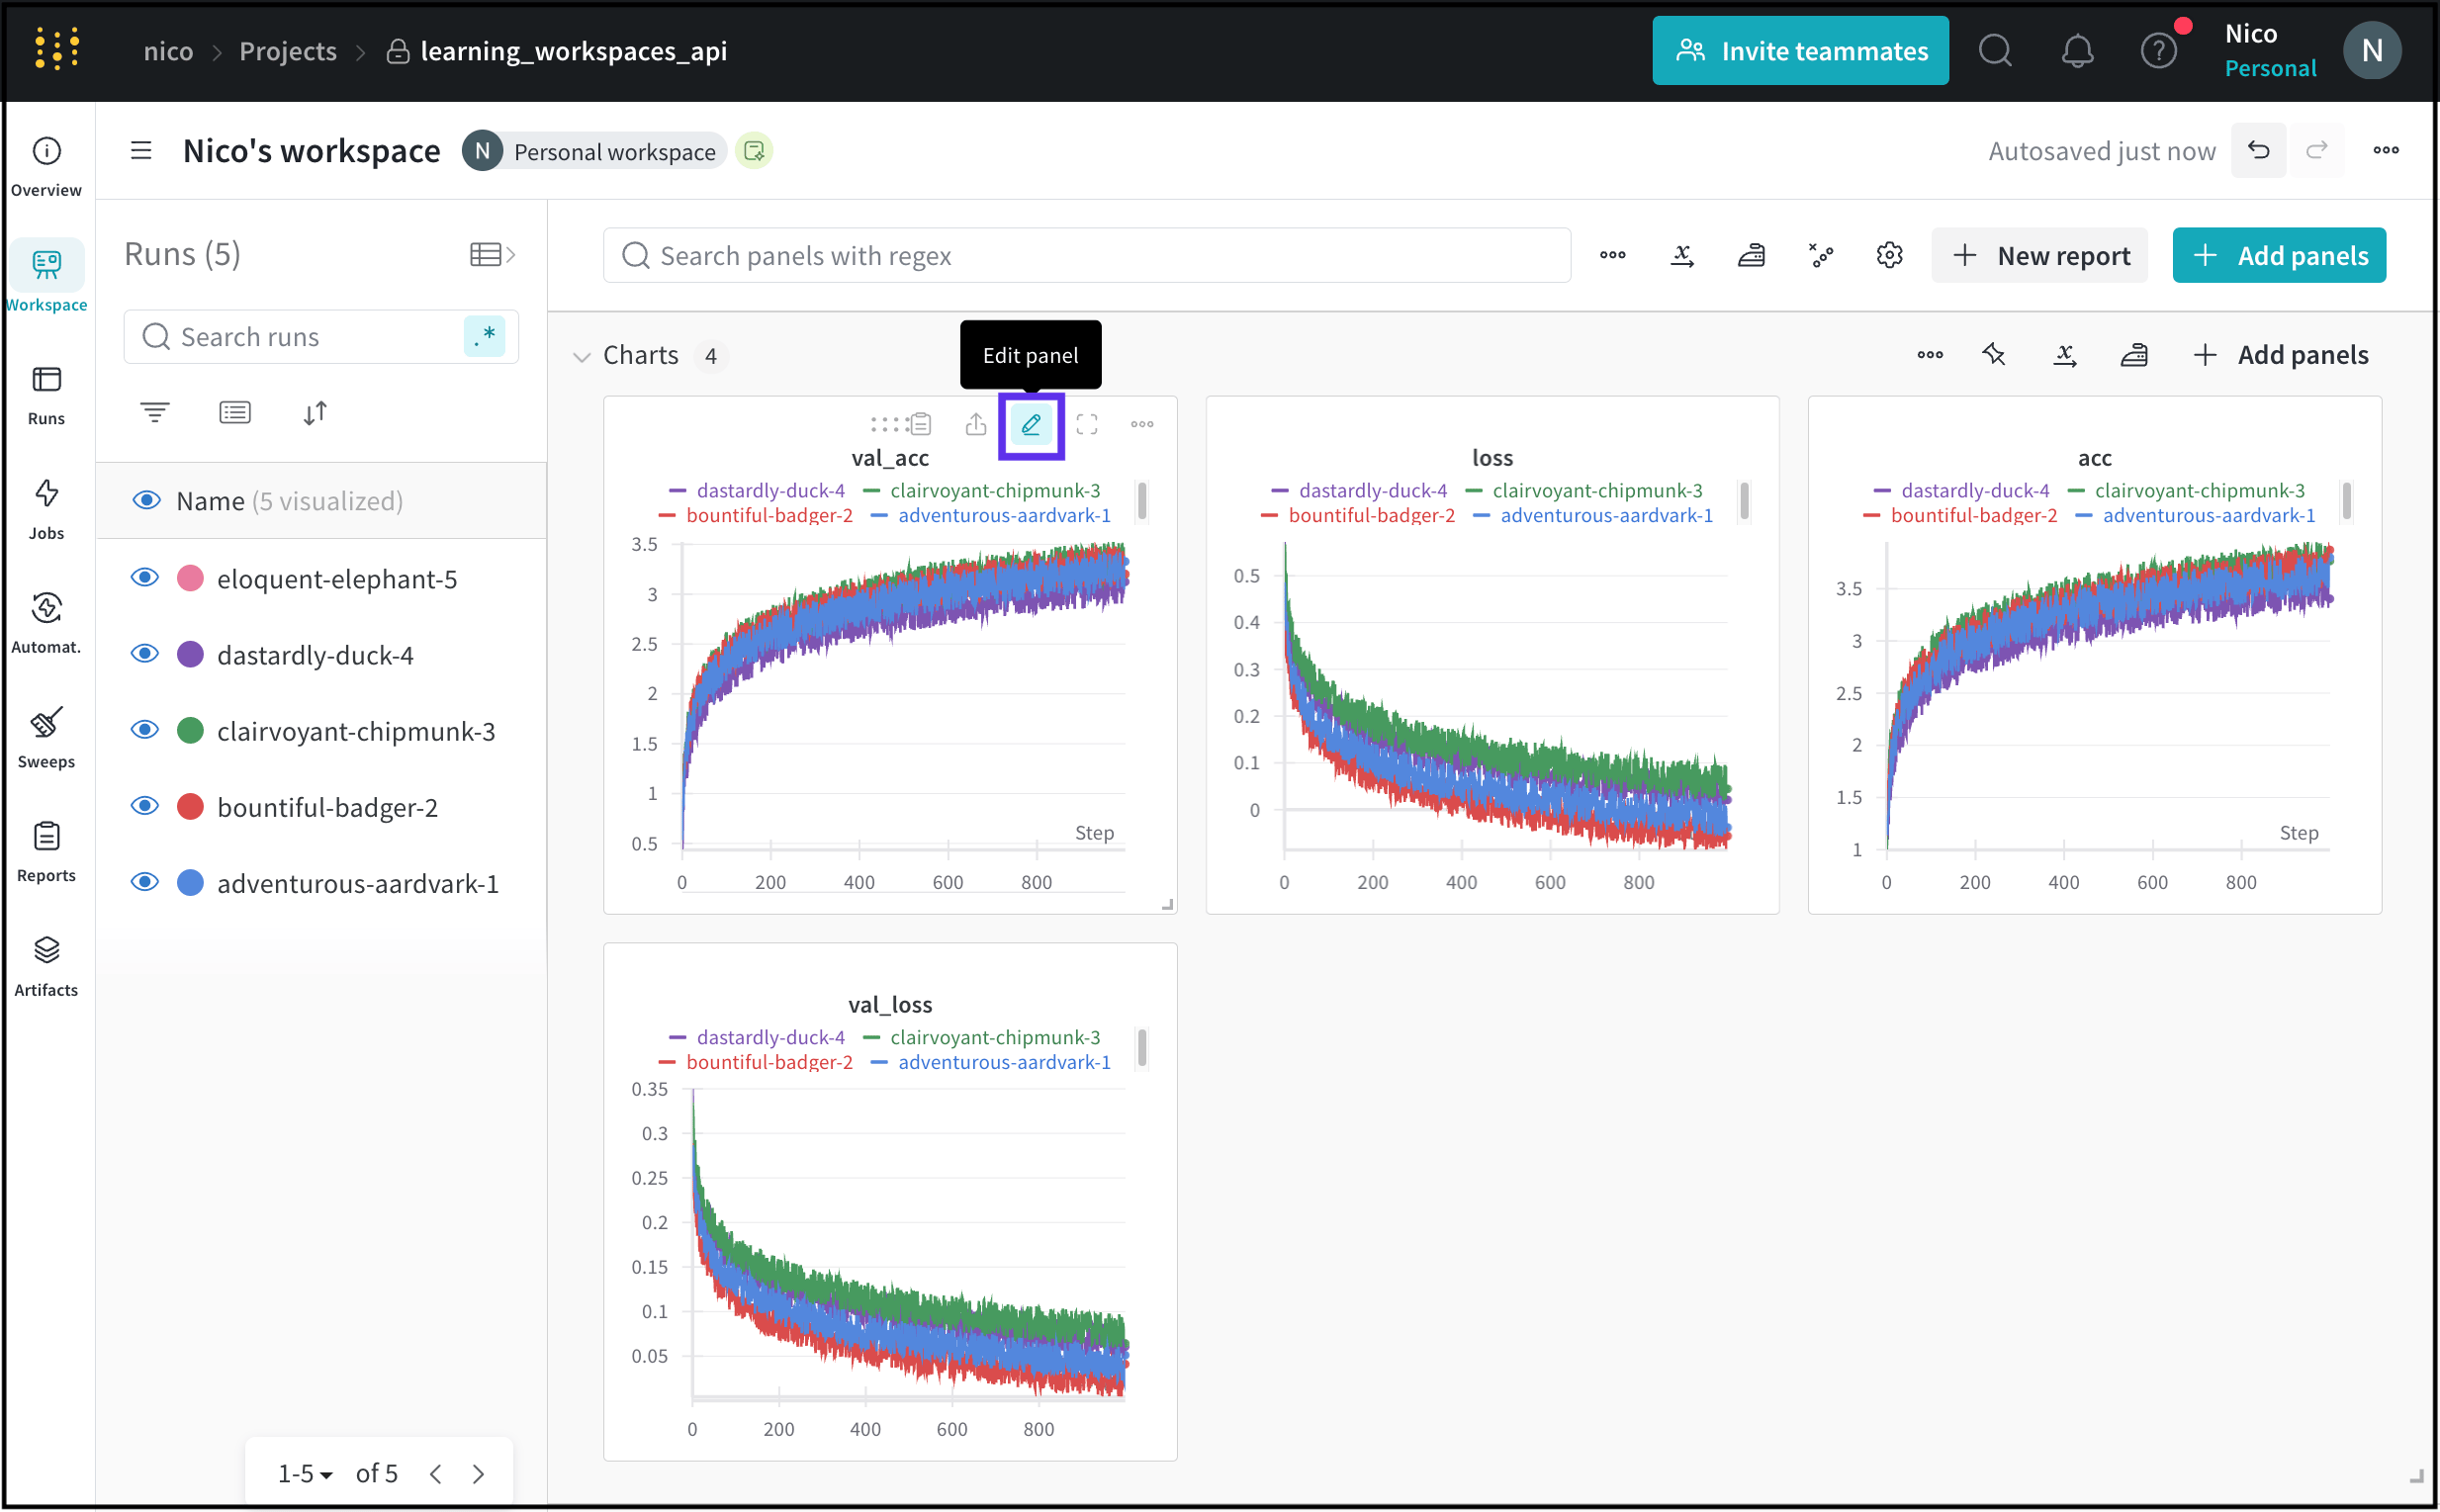
- Within the modal that appears, you can edit settings related to the panel’s data, display preferences, and more.