

Import and log your dataset CSV file
We suggest you use W&B Artifacts to make the contents of the CSV file easier to re-use.- To get started, first import your CSV file. In the following code snippet, replace the
iris.csvfilename with the name of your CSV filename:
- Convert the CSV file to a W&B Table to utilize W&B Dashboards.
- Next, create a W&B Artifact and add the table to the Artifact:
- Lastly, start a new W&B Run to track and log to W&B with
wandb.init():
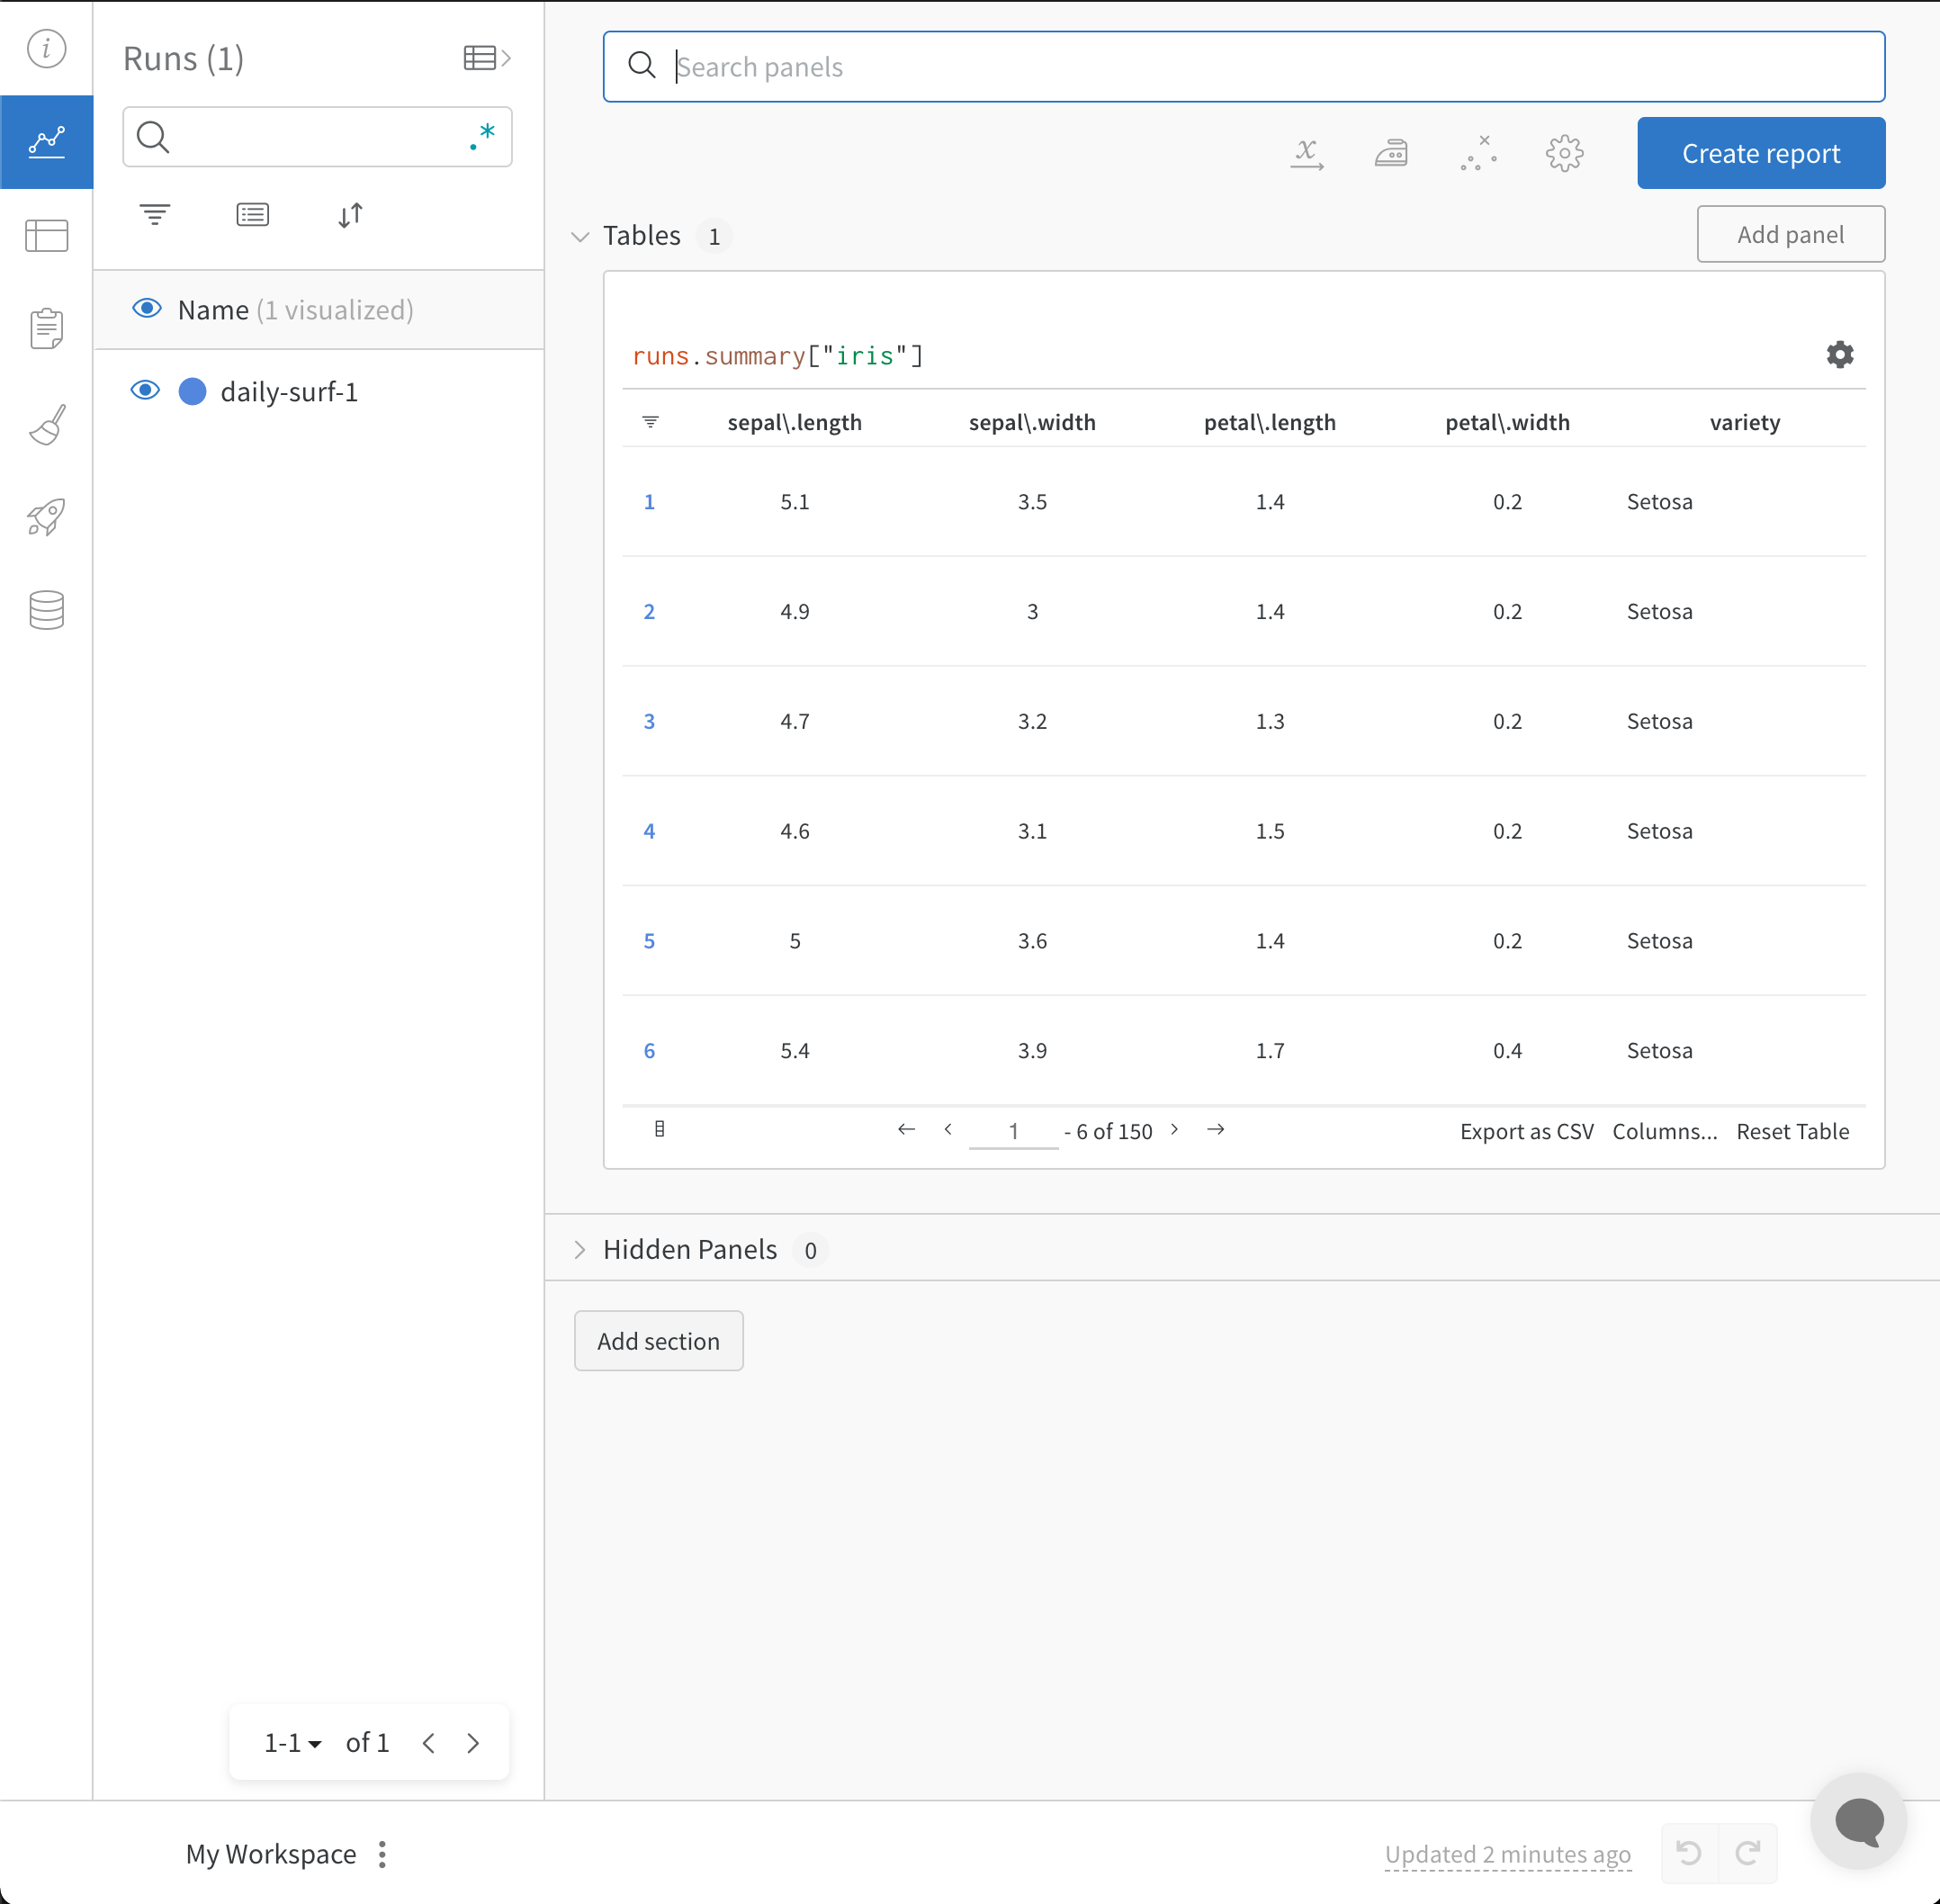
wandb.init() API spawns a new background process to log data to a Run, and it synchronizes data to wandb.ai (by default). View live visualizations on your W&B Workspace Dashboard. The following image demonstrates the output of the code snippet demonstration.
Import and log your CSV of Experiments
In some cases, you might have your experiment details in a CSV file. Common details found in such CSV files include:- A name for the experiment run
- Initial notes
- Tags to differentiate the experiments
- Configurations needed for your experiment (with the added benefit of being able to utilize our Sweeps Hyperparameter Tuning).
W&B can take CSV files of experiments and convert it into a W&B Experiment Run. The following code snippets and code script demonstrates how to import and log your CSV file of experiments:
- To get started, first read in your CSV file and convert it into a Pandas DataFrame. Replace
"experiments.csv"with the name of your CSV file:
-
Next, start a new W&B Run to track and log to W&B with
wandb.init():
run.log() command to accomplish this:
define_metric API. This example adds the summary metrics to our run with run.summary.update():